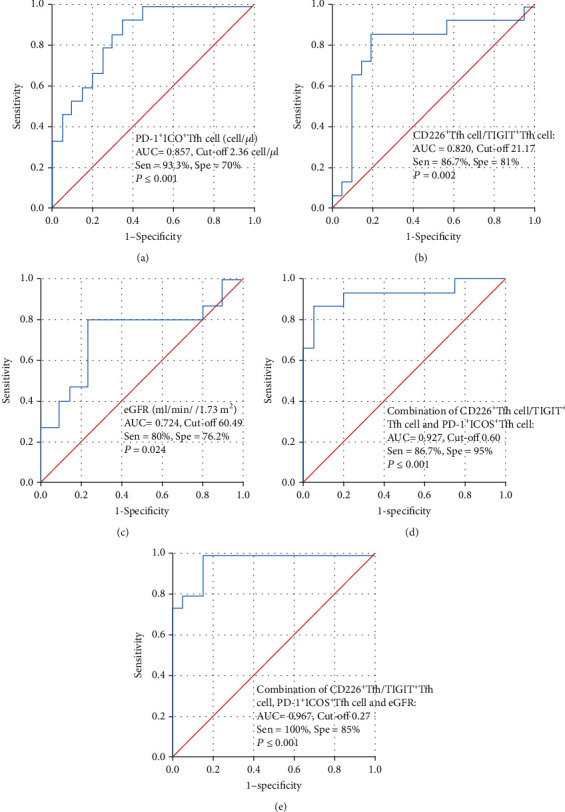
Figure 5.

ROC curves for diagnosis of CAMR. (a) ROC curve of PD-1+ICOS+Tfh cells. (b) ROC curve of CD226+Tfh cell/TIGIT+Tfh cell ratio. (c) ROC curve of eGFR. (d) Combination of CD226+Tfh cell/TIGIT+Tfh cell ratio and PD-1+ICOS+Tfh cells. (e) ROC curve of combination of CD226+Tfh cell/TIGIT+Tfh cell ratio, PD-1+ICOS+Tfh cells, and eGFR.
