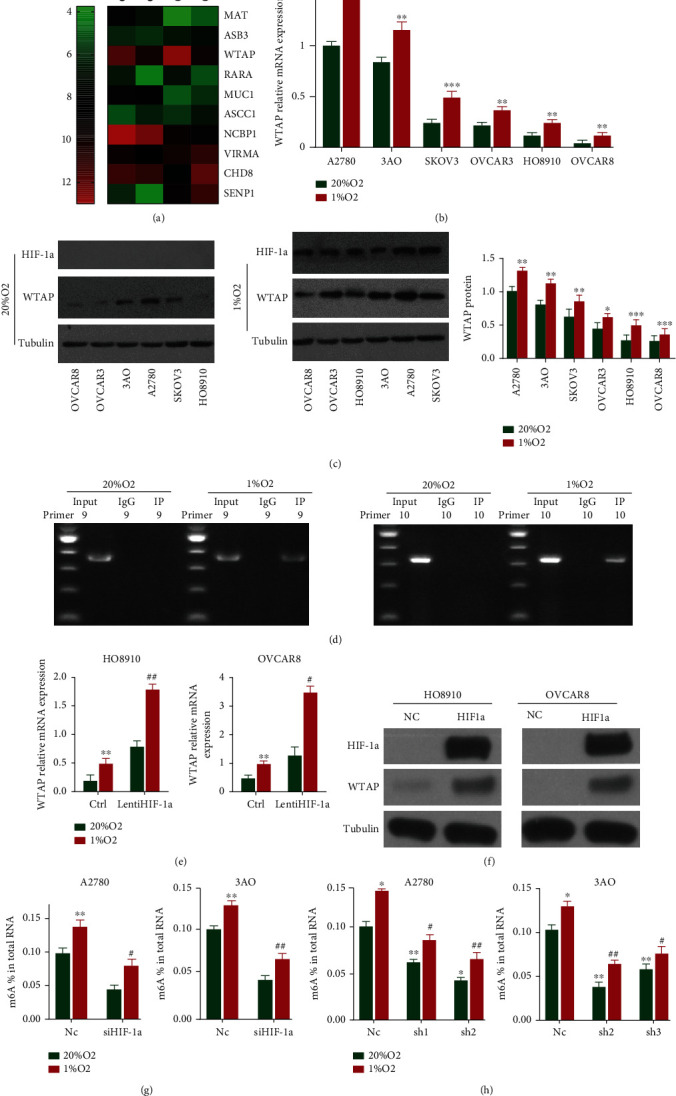
Figure 1.

Hypoxia-induced and HIF-1α-dependent WTAP expression mediates an alteration in total RNA m6A levels. (a) WTAP were remarkably upregulated under hypoxic microenvironment of 1% O2 condition compared to 20% O2 condition in two ovarian cancer cell lines (3AO and A2780) through analysis of whole genome expression profile. (b) Six human ovarian cancer cell lines (A2780, 3AO, SKOV3, OVCAR3, HO8910, and OVCAR8) were exposed to 20% or 1% O2 for 24 h, and WTAP mRNA expression was determined by RT-qPCR relative to 18S rRNA and normalized to the mean value for A2780 cells at 20% O2 (∗∗P < 0.01 and ∗∗∗P < 0.001). (c) OC cells were exposed to 20% and 1% O2 for 48 h, Western blot experiments were performed to analyze HIF-1α and WTAP protein expression. Tubulin was detected as a loading control. ( ∗∗P < 0.01, and ∗∗∗P < 0.001). (d) CHIP-PCR experiment was applied and the results demonstrated that HIF-1α which acted as a transcription factor could bind to the region corresponding to primer 9 and 10 in the promoter region of WTAP. (e) HO8910 and OVCAR8 Ctrl and LentiHIF-1α subclones were exposed to 20% or 1% O2 for 24 h. WTAP mRNA expression levels were determined as a percentage of all adenosine residues in RNA (∗∗P < 0.01 vs. 20% O2; #P < 0.05 and ##P < 0.01 vs. 1% O2 Ctrl). (f) Western blot experiments were performed to detect the expression levels of HIF-1α and WTAP. (g) A2780 and 3AO Nc and siHIF-1α subclones were exposed to 20% or 1% O2 for 24 h. m6A levels were determined as a percentage of all adenosine residues in RNA (∗∗P < 0.01 vs. 20% O2; #P < 0.05 and ##P < 0.01 vs. 1% O2 NC). (h) A2780 and 3AO Nc and WTAP knockdown (sh1 sh2 in A2780 and sh2 sh3 in 3AO) subclones were exposed to 20% or 1% O2 for 24 h. m6A content was determined as a percentage of all adenosine residues (∗P < 0.05 and ∗∗P < 0.01 vs. 20% O2; #P < 0.05 and ##P < 0.01 vs. 1% O2 NC).
