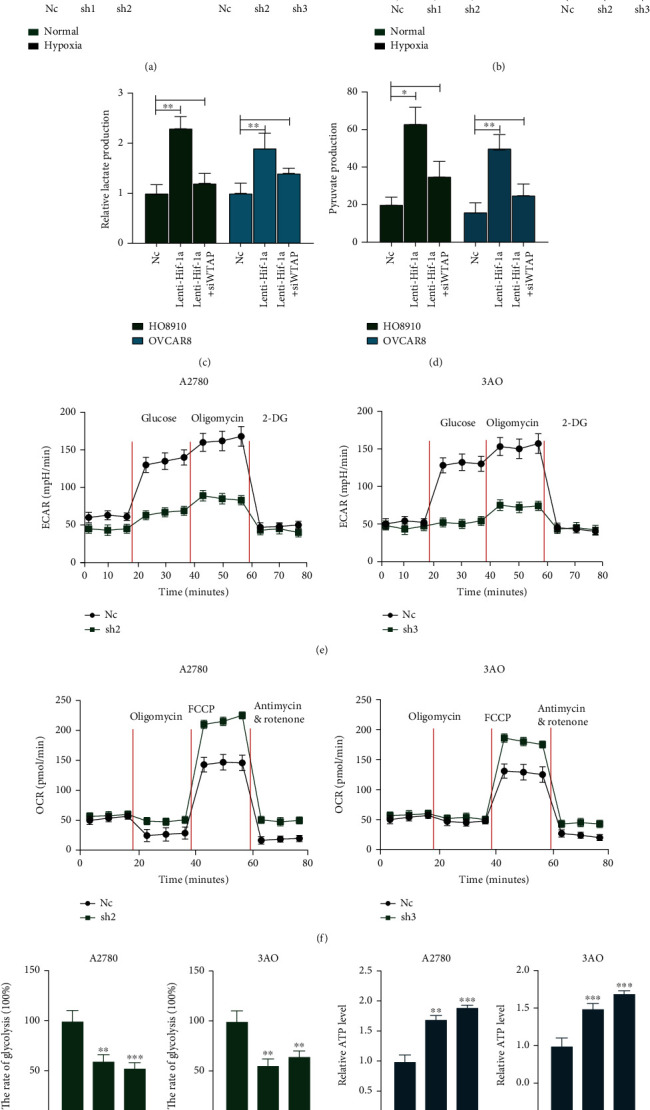
Figure 7.

WTAP promotes the Warburg effect in OC cells. (a and b) Alterations in lactate production (a) and pyruvate production (b) levels were analyzed after transfection of A2780 and 3AO cells with sh-NC, sh-WTAP in normal and hypoxia environment, ∗∗P < 0.01 vs. NC group; ##P < 0.01 vs. Normal group. (c and d) Alterations in lactate production (c) and pyruvate production (d) levels were analyzed after transfection of HO8910 and OVCAR8 cells with NC, Lenti HIF-1α, SI-WTAP reversing this effect. ∗P < 0.05 and ∗∗P < 0.01. (e) The extracellular acidification rate was analyzed after transfection of A2780 and 3AO cells with sh-NC, sh-WTAP. (f) The oxygen consumption rate was analyzed after transfection of A2780 and 3AO cells with sh-NC, sh-WTAP. (g and h) The glycolysis rate (g) and ATP level (h) were detected after transfection of A2780 and 3AO cells with sh-NC, sh-WTAP.
