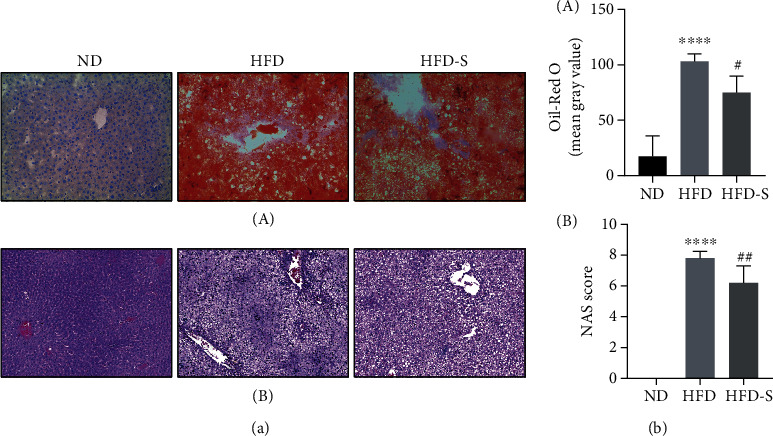
Figure 10.

Hepatic pathology results (n = 5, mean ± SD). (a) The hepatic pathology results. (A) The Oil Red O staining (×100). B The HE staining (×200). (b), (A) The results of semiquantitative Oil Red O staining. (B) The NAS score results.∗∗∗∗p < 0.0001 vs. ND; ##p < 0.01 vs. HFD.
