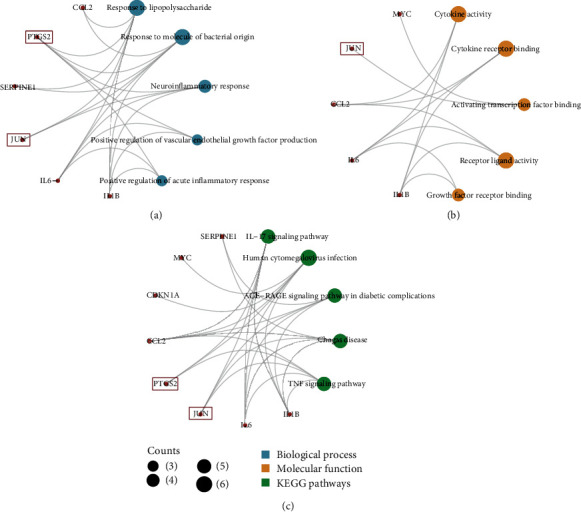
Figure 6.

“Enrichment analysis” network. (a) The subnetwork of biological processes. (b) The subnetwork of molecular functions. (c) The subnetwork of KEGG pathways. The red nodes represent the targets gene of SQP, the blue nodes represent biological processes associated with these genes, the yellow nodes represent molecular functions associated with these genes, and the green nodes represent the KEGG pathways associated with these genes.
