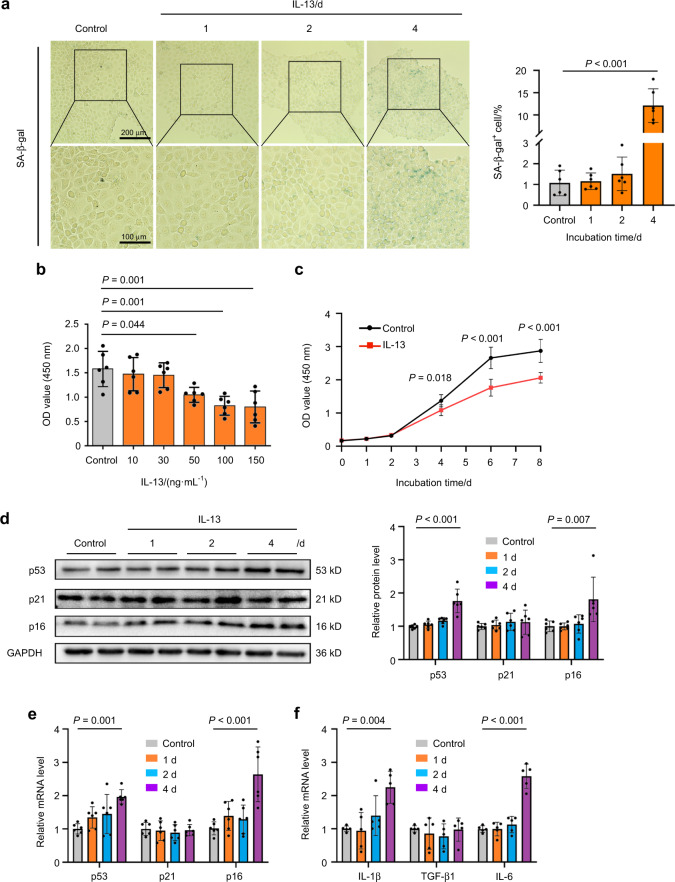
Fig. 2.
IL-13 promotes cellular senescence in SMG-C6 cells. a SA-β-gal staining (left) and quantitative analysis (right) in the SMG-C6 cells treated with IL-13 (50 ng·mL−1) for 1, 2, and 4 days (n = 6 per group). b SMG-C6 cell proliferation ability was evaluated by CCK8 experiment after treatment with different concentrations of IL-13 for 4 days (n = 6 per group). c SMG-C6 cell proliferation ability was detected by CCK8 experiment after IL-13 (50 ng·mL−1) treated for different time points (n = 6 per group). d Western blot and quantitative analysis showing the protein expression of p53, p21, and p16 in SMG-C6 cell after IL-13 (50 ng·mL−1) treatment for 1, 2, and 4 days (n = 6 per group). e, f Quantitative real-time PCR analysis showing the mRNA expression of p53, p21, p16 (e) (n = 6 per group), IL-1β, TGF-β1, and IL-6 (f) (n = 5 per group) after IL-13 (50 ng·mL−1) treatment for 1, 2, and 4 days in SMG-C6 cells. The significance of differences between groups was analyzed by one-way ANOVA followed by Bonferroni’s test. Data are presented as the mean ± SD

