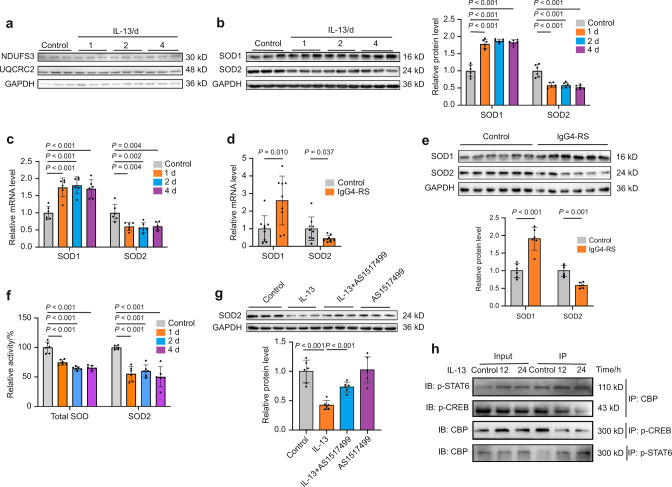
Fig. 7.
IL-13 decreases the expression and activity of SOD2 by decreasing the transcription activity of CREB. a–c SMG-C6 cells were incubated with IL-13 (50 ng·mL−1) for 1, 2, and 4 days. a Western blot analysis showing the expression of NDUFS3 and UQCRC2 proteins in SMG-C6 cells (n = 6 per group). b Western blot (left) and quantitative analysis (right) showing the expression of SOD1 and SOD2 proteins in SMG-C6 cells (n = 6 per group). c The mRNA expression of SOD1 and SOD2 were measured by quantitative real-time PCR in SMG-C6 cells (n = 6 per group). d, e Quantitative real-time PCR (d) (n = 9 per group) and western blot (e) (n = 6 per group) analysis showing the mRNA and protein expression of SOD1 and SOD2 in the SMGs of IgG4-RS patients and controls, respectively. f The activities of total SODs and SOD2 were detected in SMG-C6 cells treated with IL-13 (50 ng·mL−1) for 1, 2, and 4 days. Total SODs and SOD2 activities were normalized to the total protein content (n = 6 per group). g SMG-C6 cells were pretreated with AS1517499 (100 nmol·L−1) for 30 min, and then incubated with IL-13 (50 ng·mL−1) for 4 days. The protein expression of SOD2 was measured by western blot (n = 6 per group). h SMG-C6 cells were incubated with IL-13 (50 ng·mL−1) for 12 and 24 h. Co-IP and western blot analysis showing the interactions between CBP and p-STAT6 or p-CREB. The significance of differences between groups was analyzed by unpaired Student’s t-test (d, e) or one-way ANOVA followed by Bonferroni’s test (b, c, f, g). Data are presented as the mean ± SD

