
Fig. 4 |. Bioengineered Cargocytes actively and specifically home to the inflamed ear.
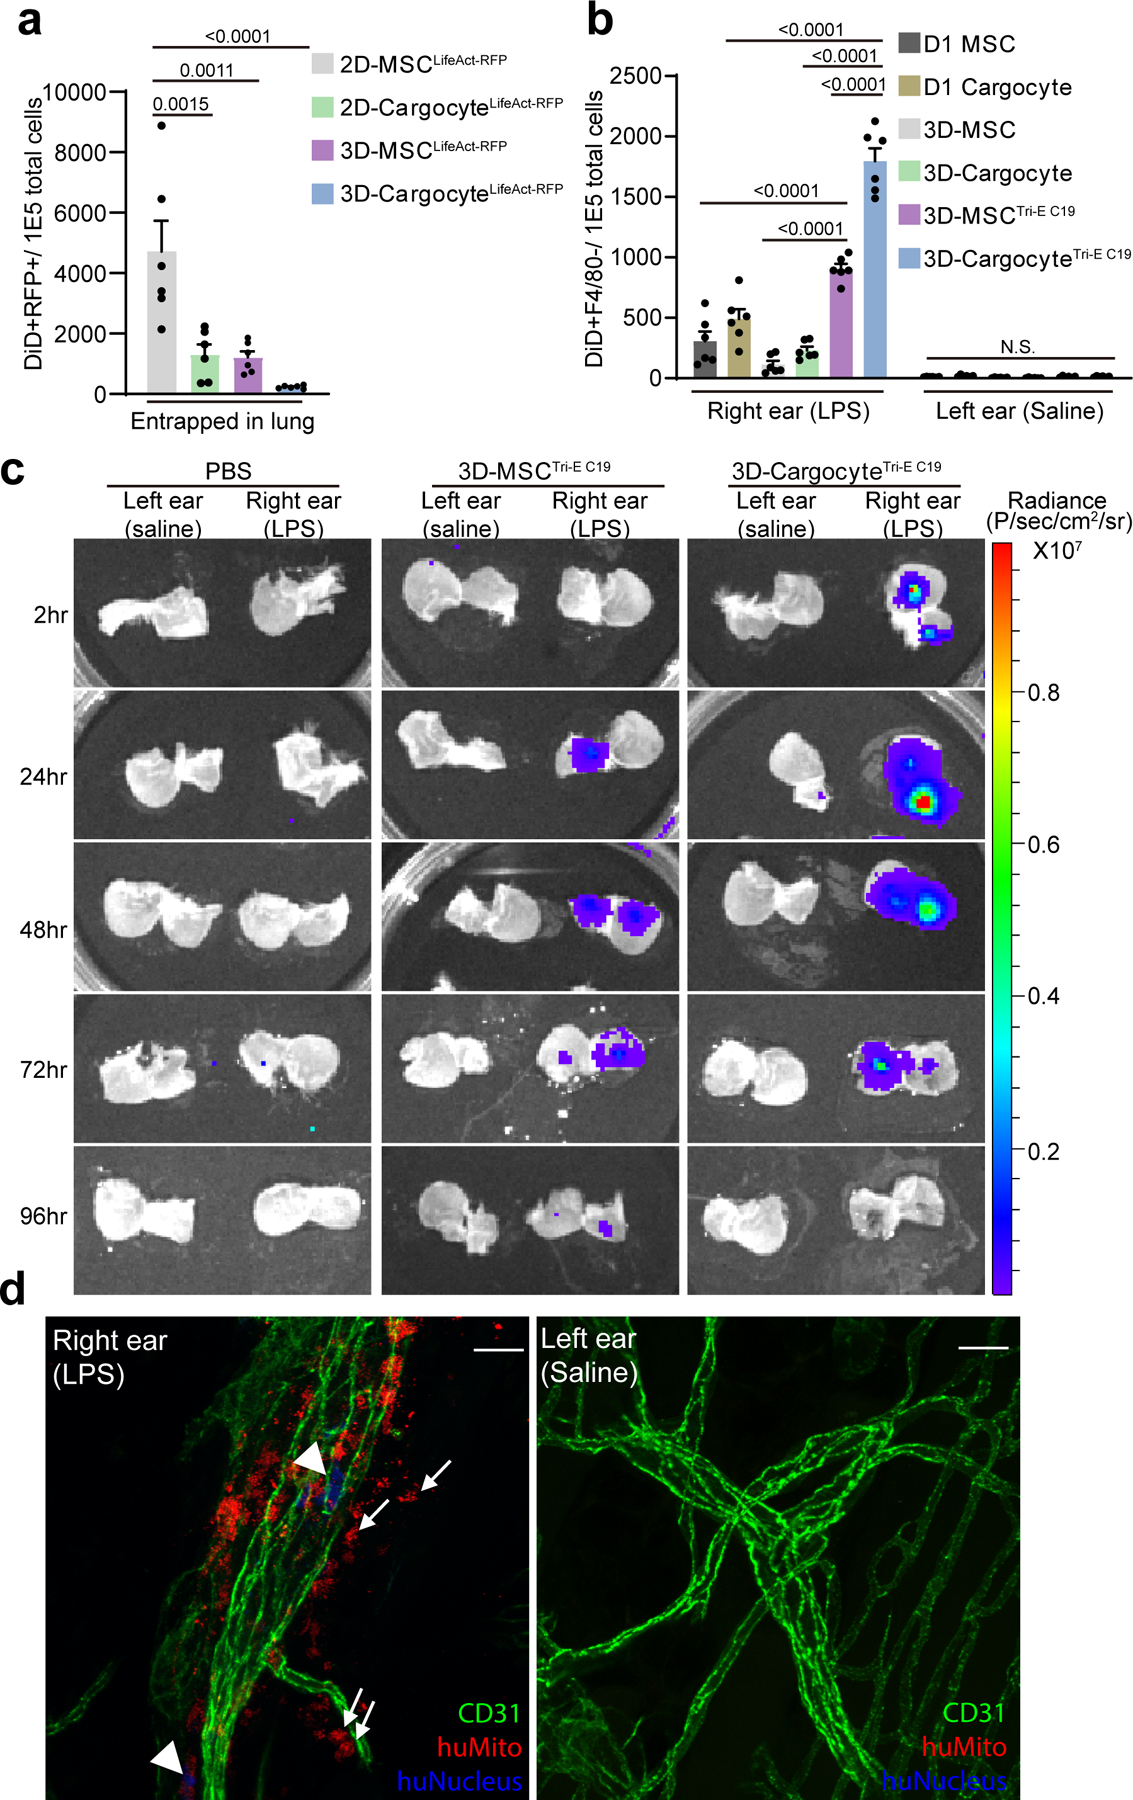
a, Bar graphs show the number of DiD+RFP+ double-positive cells out of 1E5 total cells harvested from mouse lung 24hr post-intravenous (i.v.) injection and detected by flow cytometry. Mean ± SEM, n=6 mice. b, Mice were intradermally (i.d.) injected with LPS in the right ear and saline in the left, followed by i.v. injection of DiD-labeled MSCs or Cargocytes 6hr later. Bar graphs show the number of DiD+F4/80− cells out of 1E5 total cells harvested from mouse ears 24hr post-injection and detected by flow cytometry. Mean ± SEM, n=6 mice. c, Mice were treated as in (b) and then i.v. injected with 1E6 3D-MSCTri-E C19 or 3D-CargocyteTri-E C19 transfected with firefly luciferase mRNA. Mice were euthanized at indicated time points after i.v. injection. The dorsal skin of the mouse ears was peeled from the underlying cartilage and the subcutaneous surfaces of the tissue were directly soaked in VivoGlo™-luciferin substrate and immediately subjected to bioluminescence imaging with IVIS Lumina Series III. See also Supplementary Fig.7a for in vitro control of luciferase activity. d, Mice treated as in (b) were i.v.-injected with 1E6 3D-CargocyteTri-E C19. After 24hr, mouse ears were harvested and whole-mount stained with anti-mouse CD31 (green), anti-human Mitochondrial (red), and anti-human nucleus antigen (blue). Confocal images from Olympus FV1000 were analyzed with Fiji ImageJ. Maximum projection of Z-stacks of images of ears from the same mouse were shown. Arrows point to human Cargocytes, and arrowheads point to human nuclei. Representative images out of 10 images obtained are shown. Scale bar, 20μm. For (a) and (b), adjusted P values shown above the bars, one-way ANOVA with Tukey’s multiple comparisons test. All data are representative of at least 2 independent experiments.