
Fig. 6 |. Bioengineered Cargocytes ameliorate Caerulein-induced acute pancreatitis.
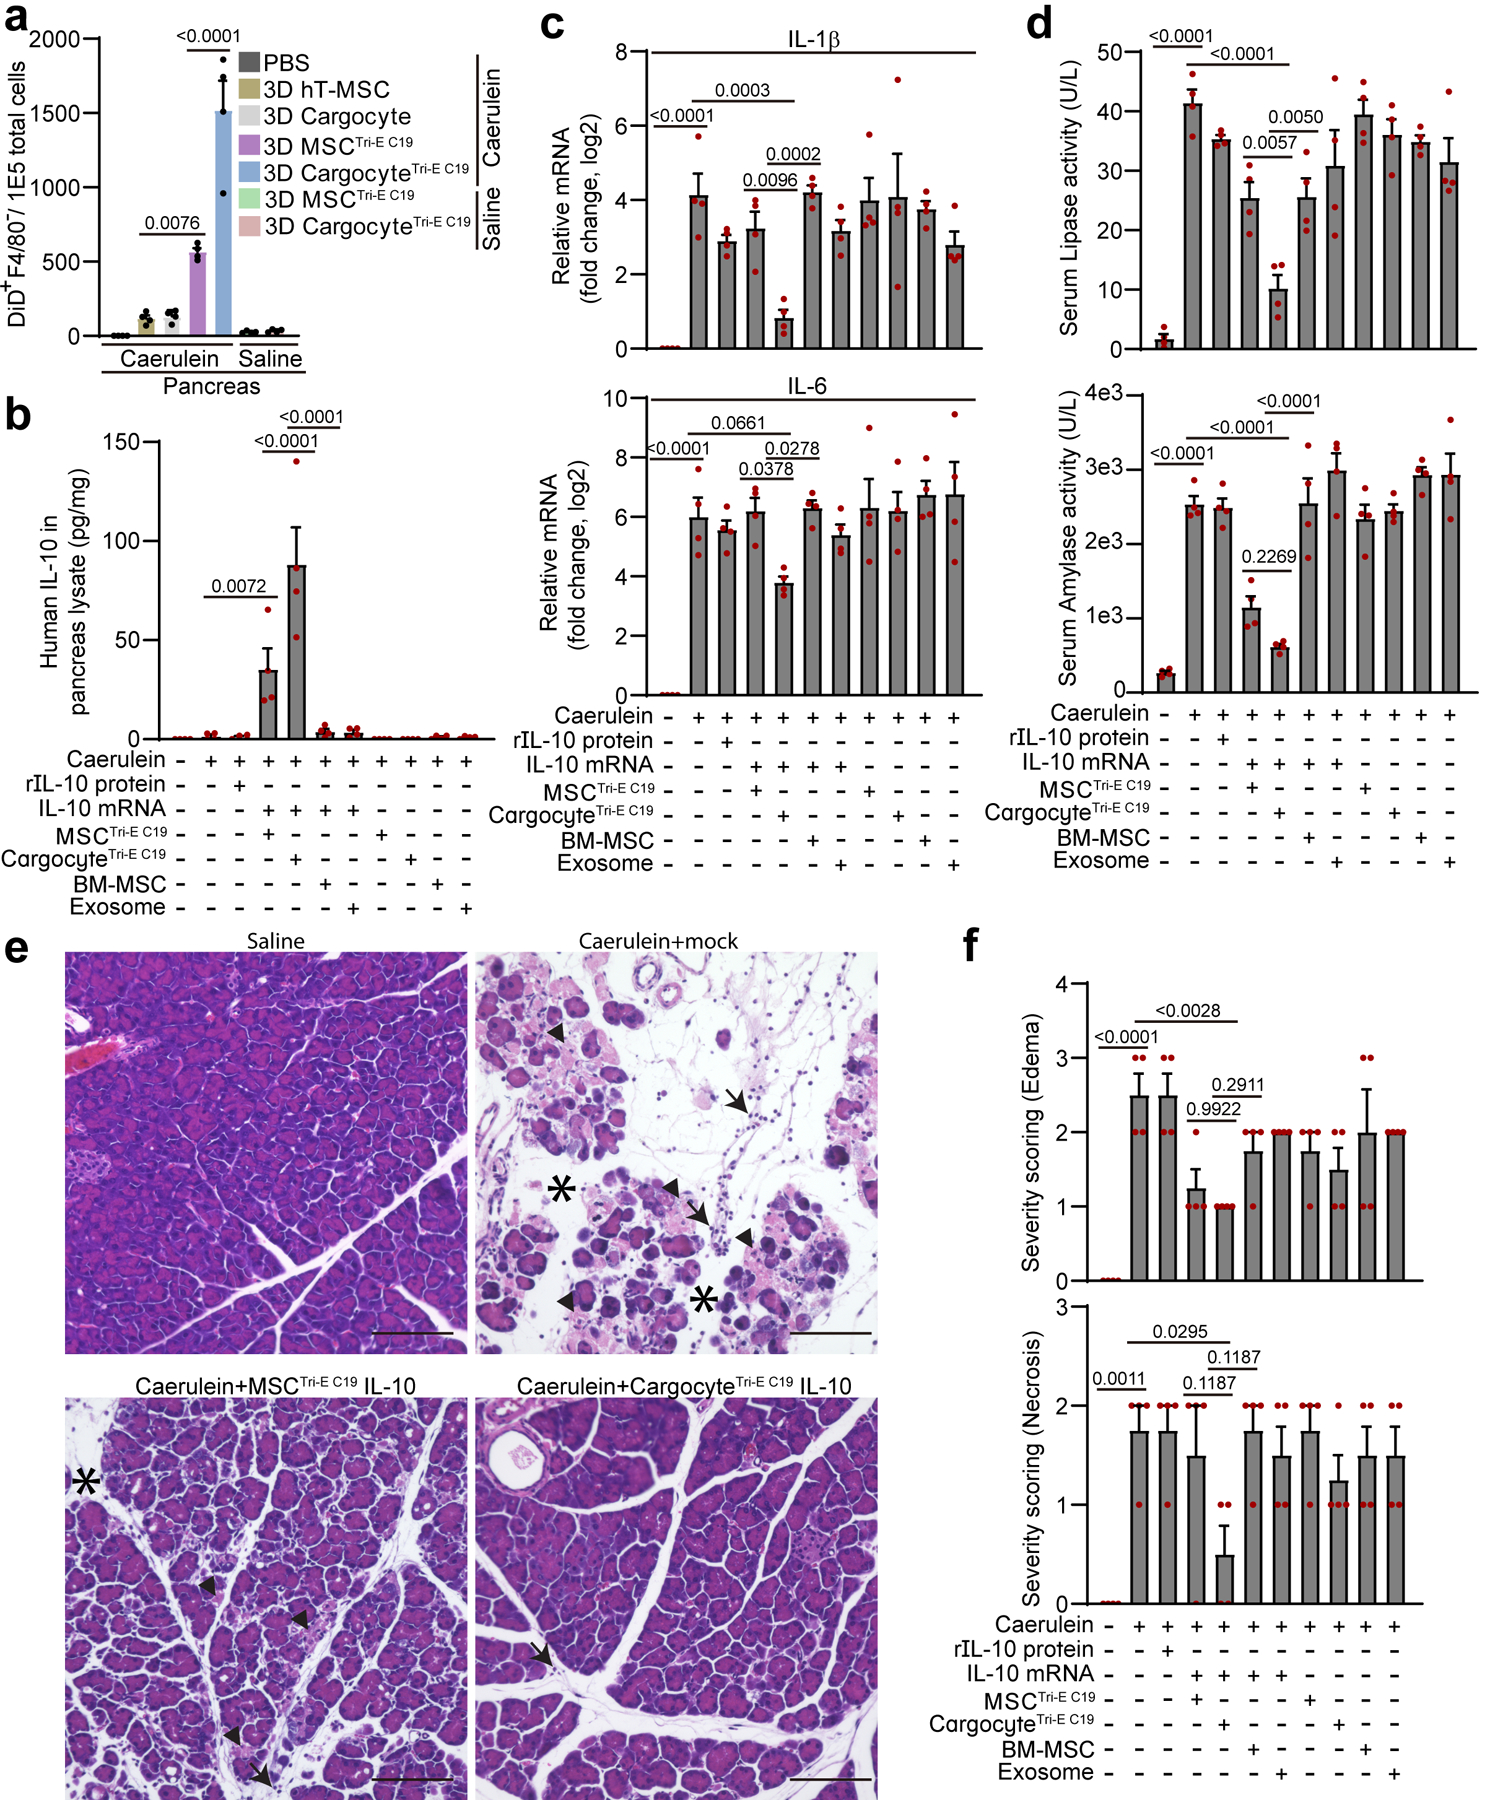
a, Acute pancreatitis was induced by intraperitoneal (i.p.) injection of Caerulein in BalB/c mice, followed by i.v. injection of DiD-labeled MSCs or Cargocytes. Bar graphs show the number of DiD+F4/80− cells out of 1E5 total cells harvested from mouse pancreas 16hr post-injection and detected by flow cytometry. Mean ± SEM, n=4 mice. From (b) to (e), Mice with Caerulein-induced AP were i.v.-injected with indicated treatments. Mouse tissues were harvested 16hr post-injection. b, Bar graph shows the level of human IL-10 protein detected by ELISA from mouse pancreas from indicated treatment. Mean ± SEM, n=4 mice. See also Supplementary Fig.14a and b for in vitro transfection controls. c, Bar graph shows the relative mRNA expression of IL-1β (upper) and IL-6 (lower) detected by real-time RT-PCR in the mouse pancreas from indicated treatment. Graphs show the fold change (Log2) of the indicated mRNA markers normalized to no Caerulein treatment group. Mean ± SEM, n=4 mice. d, Bar graph shows the lipase activity (upper) and amylase activity (lower) detected in the mouse serum from indicated treatment. Mean ± SEM, n=4 mice. e, Representative light microscopy images of pancreas from mice treated as in (c) and harvested at 16hr post-injection and processed for hematoxylin and eosin staining. Arrows point to infiltrated leukocytes, arrowheads point to necrosis, and asterisks label edema. Scale bar, 100μm. f, Histological analysis of pancreas treated as in (e). The severity of edema (upper) and necrosis (lower) were graded from 0 to 3 using established criteria. See also Supplementary Fig.14e and f for inflammatory cell infiltration. Mean ± SEM, n=4 mice. All statistics are one-way ANOVA with Dunnett’s correction for multiple testing, and P values for more post-hoc comparisons can be found in Supplementary Table 10. All data are representative of at least 2 independent experiments.