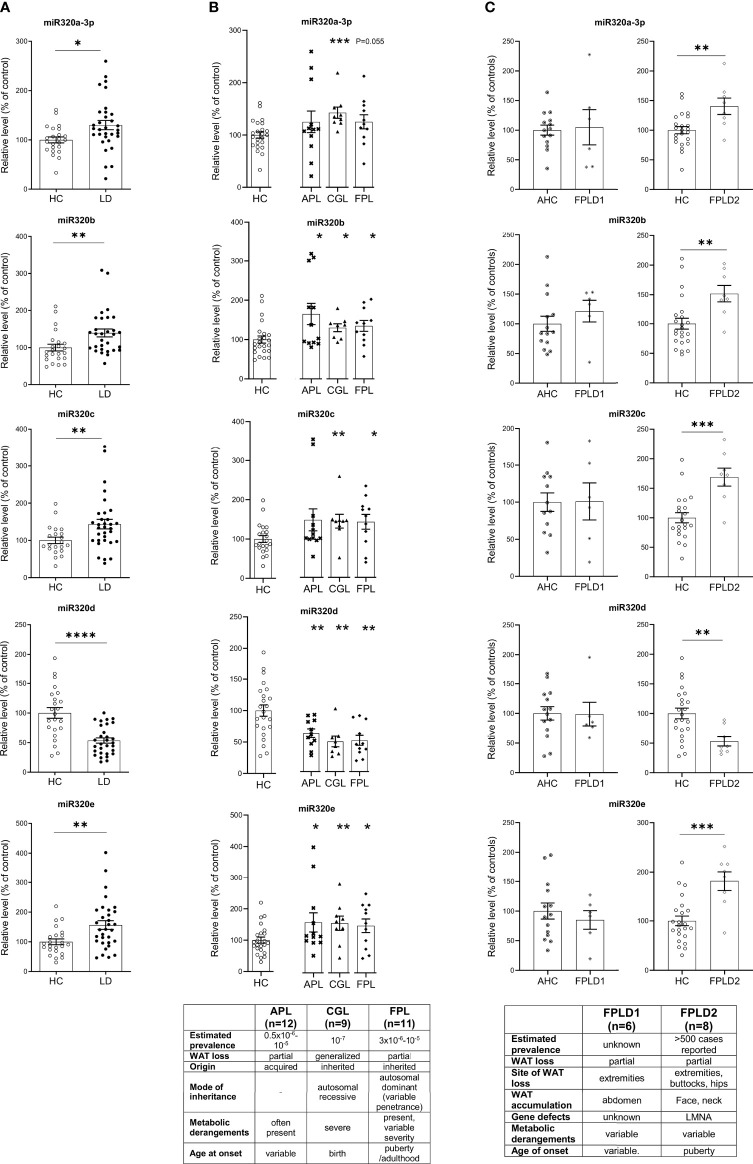
Figure 2.
Relative level of cmiRs-320 in LD and HC subjects. (A) Scatter plots with error bar of cmiRs 320 in a) LD (n = 32) versus HC (n = 23). (B) in APL (n = 12), CGL (n = 9), FPL (n = 11) versus HC. Each asterisk denotes a pairwise comparison of 2 groups. (C) FPLD1 (n = 6) versus an ad-hoc selected group of age matched controls Adult Healthy Controls (AHC) (n = 14) and FPLD2 (n = 8) versus HC. Data, expressed as percentage of the mean of HC or AHC (in the case of FPLD1), are shown as mean ± SEM (standard error of the mean). *P < 0.05, **P < 0.01, ***P < 0.001, ****P < 0.0001, by Student’s t test or Mann-Whitney as appropriate.

