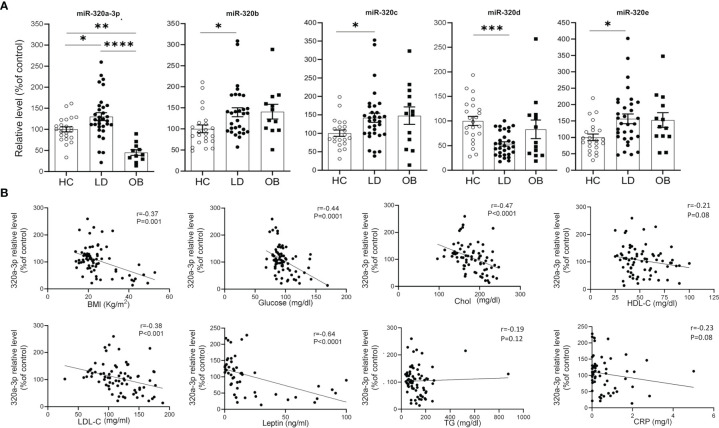
Figure 3.
Relationship between cmiRs-320s and metabolism. (A) Scatter plots with bar of circulating miRNAs from the 320 family in HC, LD and OB subjects. All data are expressed as percentage of the mean of HC and are shown as mean ± SEM. *P < 0.05, **P < 0.01, ***P < 0.001 and ****P < 0.0001 by one-way ANOVA or Kruskal-Wallis, as appropriate. (B) Correlation analysis between BMI, glucose, total cholesterol, HDL-C, LDL-C, plasma leptin, triglycerides, CRP and cmiRs-320a-3p in the total population (LD + OB + HC). Spearman’s r and relative p-value are indicated.

