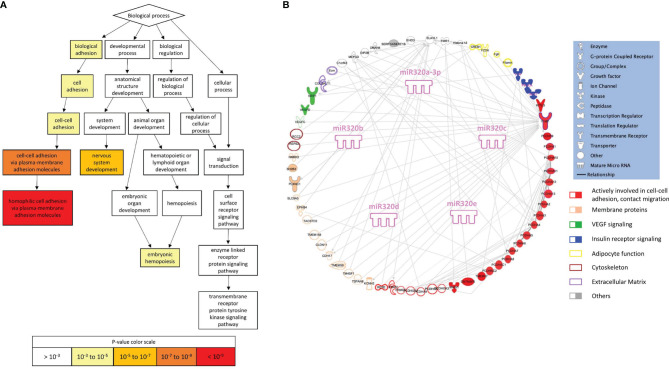
Figure 4.
Gene ontology and pathway analysis. (A) Visualization of enriched GO terms for a ranked list of 320 miRNA targets (from the publicly available platform GOrilla). The white to red scale indicates progressively increased significance of the enrichment. (B) Graphical representation of the network generated by the proteins included in the enriched GO terms (elaborated using IPA, Qiagen, Hilden, Germany).

