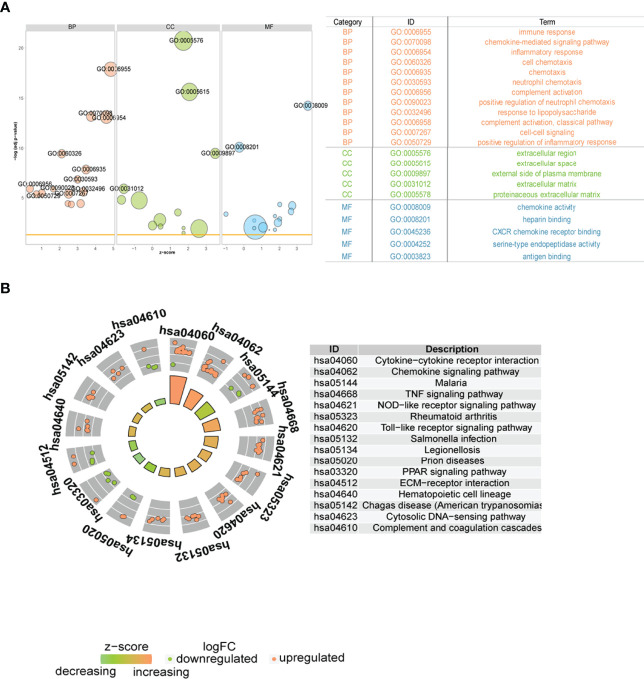
Figure 11.
Functional analysis between two different immune patterns. (A) Gene Ontology (GO) functional enrichment analysis: vertical coordinate is the significance of the enrichment result; horizontal coordinate is the Z-score; node color indicates BP, CC, MF; node size indicates the number of genes contained in the current GO term. (B) Kyoto Encyclopedia of Genes and Genomes pathway enrichment analysis results: node color indicates gene expression level; quadrilateral color indicates Z-score. BP, Biological Process; MF, molecular function; CC, cellular component.

