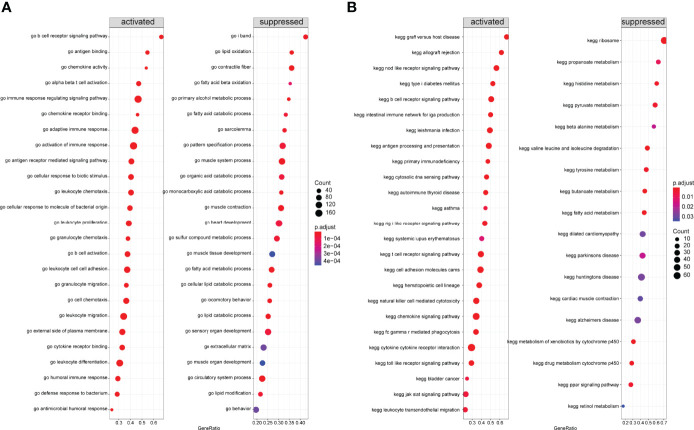
Figure 12.
Gene Set Enrichment Analysis (GSEA) between two different immune models. (A) GSEA-GO analysis: horizontal coordinate is the gene ratio; vertical coordinate shows the GO terms; color indicates -log10 (p-value); node size indicates the number of genes enriched in GO terms. (B) GSEA-KEGG analysis: horizontal coordinate is the gene ratio; vertical coordinate shows the GO terms; node size indicates the number of genes enriched in the pathway; node color indicates -log10 (p-value).

