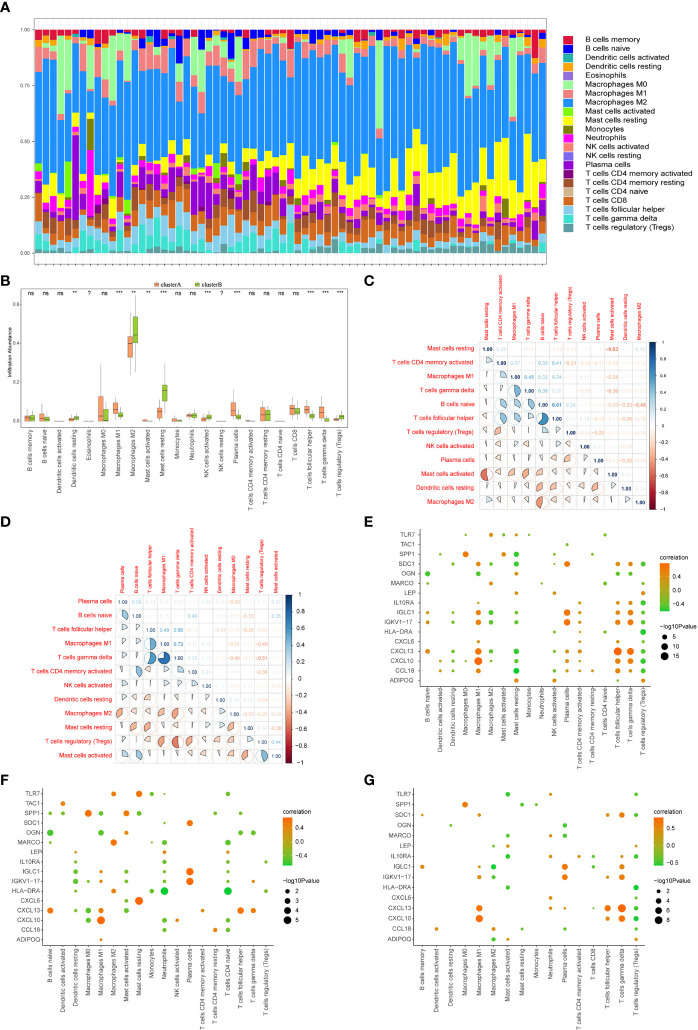
Figure 13.
Immune characteristics between two different immune patterns. (A) Immune cell content stacking plot between cluster A and cluster B: different colors indicate different immune cells; the horizontal axis is the patient ID. (B) Immune cell content histogram: the horizontal axis indicates 22 immune cells; the vertical axis indicates cell content; pink indicates cluster A samples; green indicates cluster B samples. (C) Immune cell content histogram: the horizontal axis indicates 22 immune cells; the vertical axis indicates the cell content; pink indicates cluster A samples; green indicates cluster B samples. Correlations between 12 immune cells that significantly differed between cluster A and cluster B patients in the limma algorithm: correlations in cluster A patient species (C); correlations in cluster B patient species (D); red indicates negative correlations; blue indicates positive correlations. Correlations in all arthritis patients. Correlation analysis of 16 gene signatures and immune cell content in all arthritis patients (E), cluster A arthritis patients (F) and cluster B arthritis patients (G), horizontal axis indicates immune cells, vertical axis indicates 16 gene signatures, node color indicates the correlation size, and node size indicates the significance level. (?:no data, nsP≥0.05, **P<0.01, ***P<0.001).

