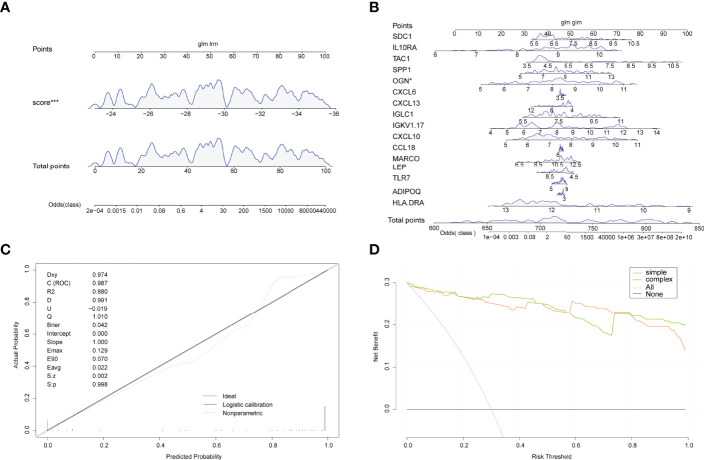
Figure 6.
Line graphs (nomogram plots). (A) Nomogram of predicted risk scores in the diagnosis of arthritis patients. (B) Nomogram of 16 trait genes in the diagnosis of arthritis patients. (C) Nomo model evaluation, where the diagnostic model is in better agreement with the ideal model. (D) Model evaluation curves: gray indicates the follow-on diagnosis, green indicates the complex diagnostic model with 17 trait genes, and pink indicates the simple diagnostic model with predicted risk score. (*P<0.05, ***P<0.001).

