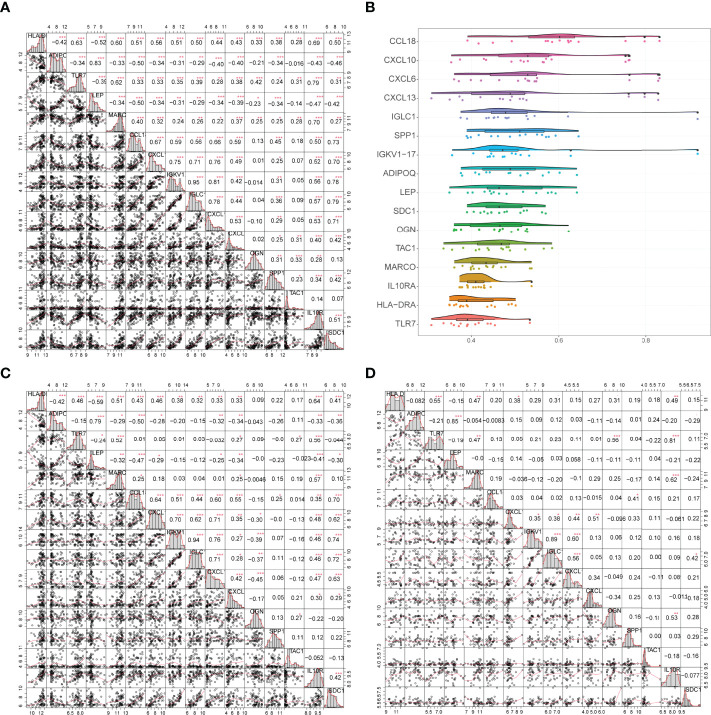
Figure 7.
(A) Correlation analysis of 16 genes in all samples: * represents the significance of the correlation, and the number represents the correlation level. (B): Functional correlation analysis of 16 trait genes, the horizontal axis indicates the correlation size and the vertical axis indicates the trait genes. (C, D) Correlation analysis of 16 trait genes in disease and normal samples: * represents the significance of correlation, and the number represents the correlation level. (*P<0.05, **P<0.01, ***P<0.001).

