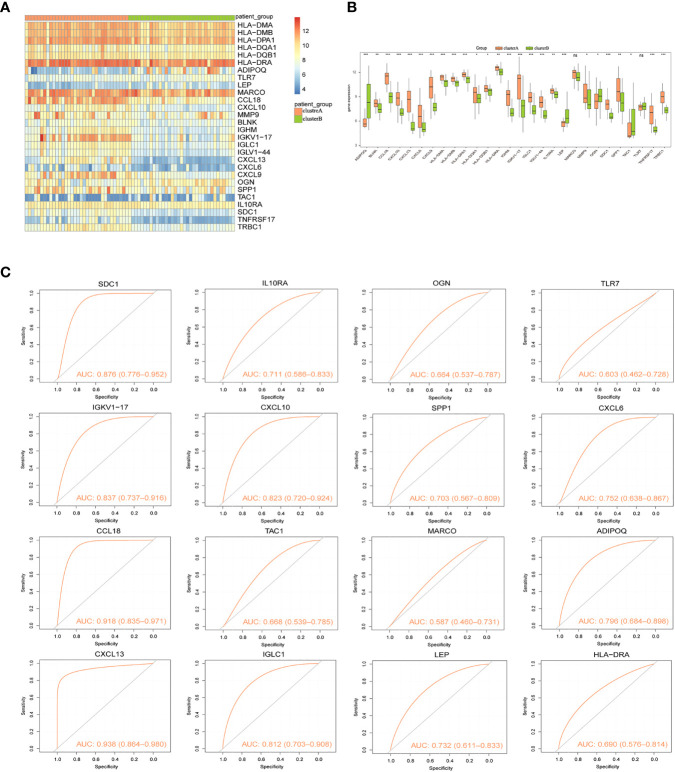
Figure 8.
Consistency clustering of gene signatures in arthritis patients. (A) Heat map of expression levels of 28 Imm-DEGs in two clusters: pink indicates cluster A, green indicates cluster B, red indicates high expression, and blue indicates low expression. (B) Expression levels of 28 Imm-DEGs in two clusters: pink indicates cluster A, green indicates cluster B, the horizontal axis is the Imm-DEGs, and the vertical axis is the gene expression level. (C) ROC curves of 16 characterized genes independently distinguished between cluster A and cluster B. (nsP≥0.05, *P<0.05, **P<0.01, ***P<0.001).

