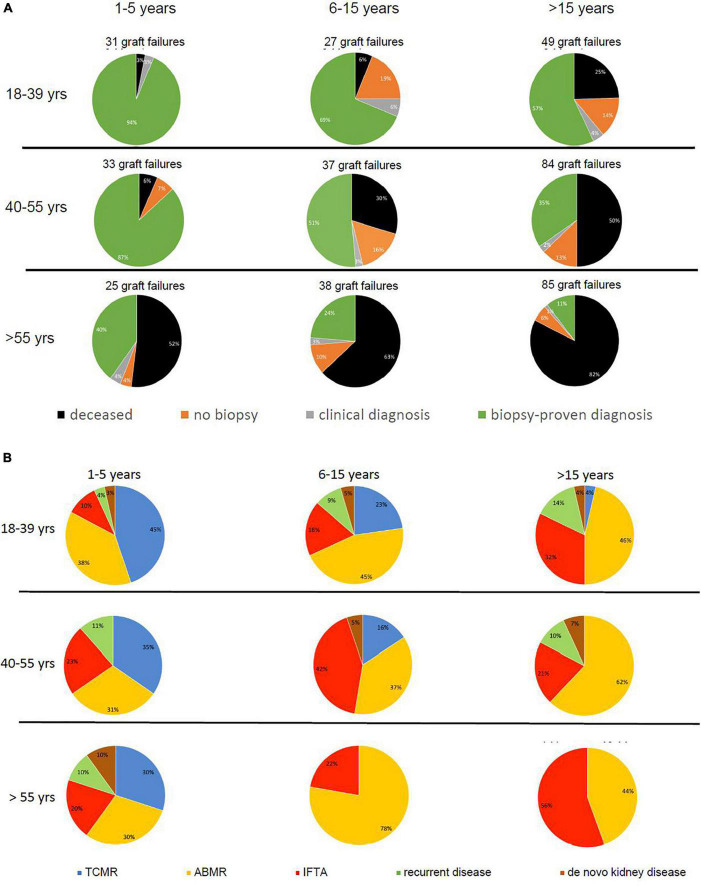
FIGURE 3.
Pie charts are given for causes of graft loss in different age groups in different time periods after transplantation starting from 1 year after transplantation. In part (A), the categories of cause for graft loss represent death with functioning graft, unknown (no biopsy performed and no clinical diagnosis), a clinical diagnosis of kidney injury or disease, and kidney biopsy-based cause of graft loss. In part (B), the category of kidney biopsy-based cause of graft loss is split into TCMR, ABMR, return original disease, and de novo kidney disease. The numbers of graft loss and recipients lost at follow-up within every post-transplantation period are shown above the pie charts. Every row of pie chart represents a recipient age category at the time of transplantation (18–39, 40–55, and > 55 years) and every column represents a time period after transplantation (1–5, 5–15, and > 15 years after transplantation).

