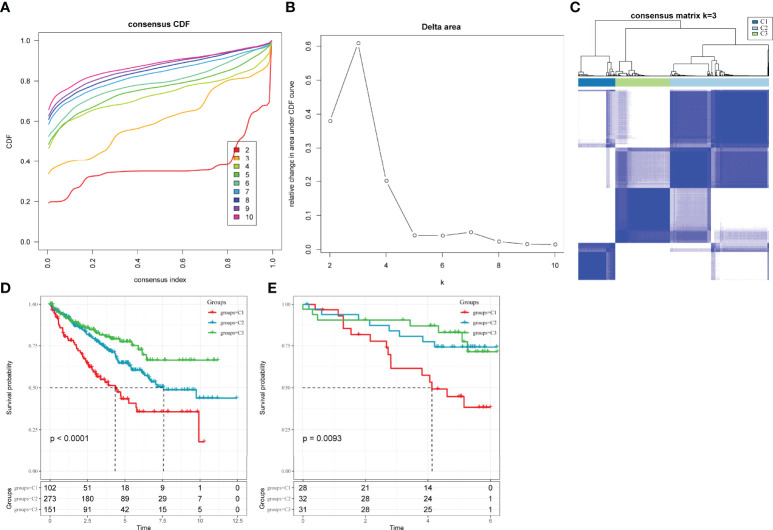
Figure 3.
Molecular subclassification of ccRCC in different cohorts. (A) CDF curves for k = 2–10 in the TCGA-KIRC cohort. (B) CDF delta area curve in the TCGA-KIRC cohort. (C) Heatmap clustering of TCGA-KIRC datasets when consensus (k) = 3. (D) The difference in survival among different molecular subtypes in the TCGA-KIRC cohort. (E) The difference in survival among different molecular subtypes in the Research Concept and Research Activities- European Project cohort.

