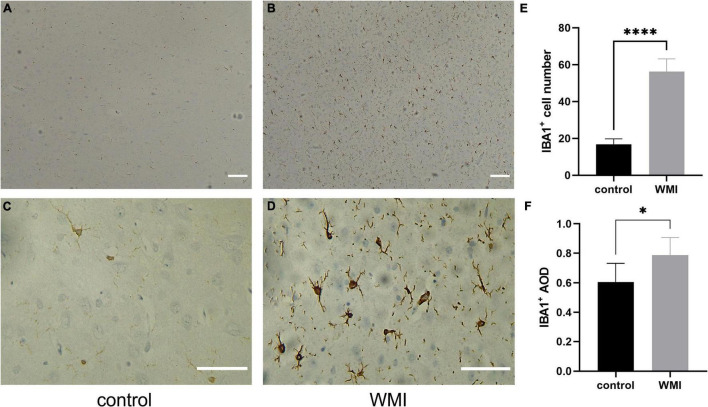
FIGURE 6.
Microglial activation in WMI group. (A,B) The control group is on the left and the WMI group is on the right. Scale bar: 200 μm. (C,D) A magnified version of A and B. IBA1 + microglia were morphologically diverse, with most cells extending processes. Scale bar: 100 μm. (E,F) Quantitative analysis of the IBA1-positive areas in each group (2–3 sections were evaluated per pup). Five regions of each specimen were randomly collected to calculate the average number of positive cells and the average optical density. Data are presented as the mean ± SE. Compared to the control group by t-test, *P < 0.05, ****P < 0.0001.

