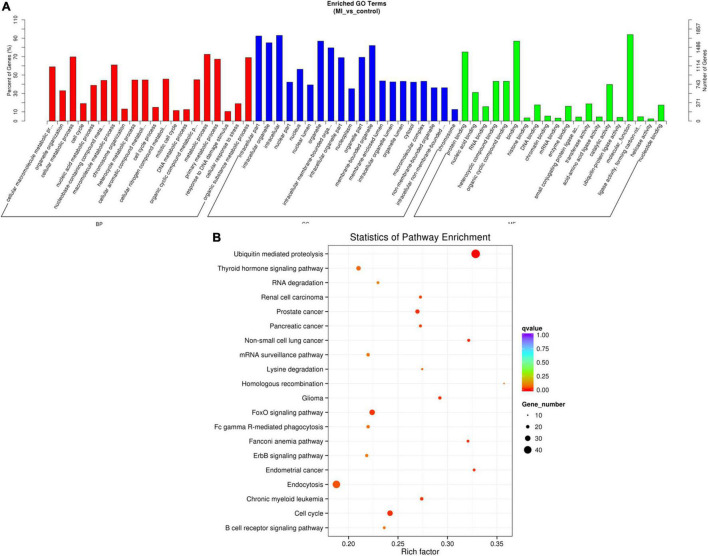
FIGURE 6.
GO and KEGG of differentially expressed circRNA genes. (A) GO analysis of differentially expressed circRNAs which covers 3 domains, namely, BP (red), CC (blue), and MF (green). Each domain contains the top 20 significantly enriched GO terms (29) and the top 20 significantly enriched pathways. (B) KEGG The y axis denotes the pathway, and the x axis denotes the rich factor. The size of the dots indicates the number of gene regulation in this pathway, and the colors of the dots correspond to different q-values. BP: biological process, CC: cellular component, MF: molecular function.

