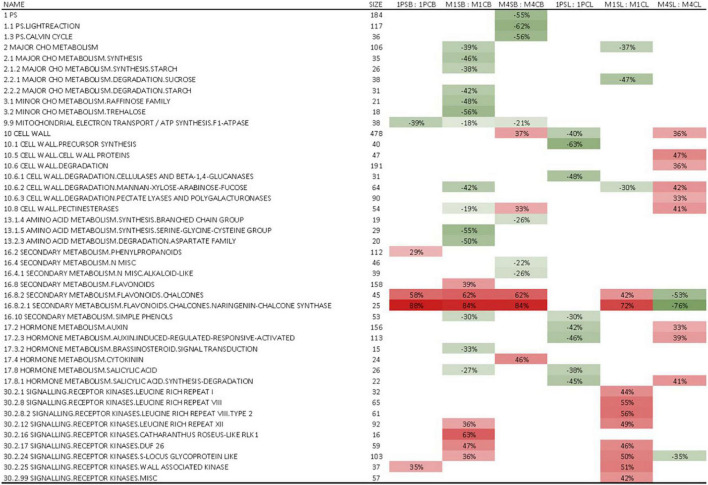
FIGURE 3.
A subset of significantly enriched gene sets obtained by GSEA (The full set is presented in Supplementary Table 2). Values represent the percentages of genes that were positively (+) or negatively (–) regulated within a particular bin in leaves and berries of cv. ‘Tempranillo’ vines grafted onto 1103-Paulsen, M1, or M4 rootstocks subjected to salinity irrigation. Only statistically significant (FDR q value < 0.25) values are shown. Red denotes positive enrichment or upregulation and green denotes negative enrichment or downregulation. C, control; S, salinity; 1P, 1103-Paulsen rootstock; M1, M1 rootstock; M4, M4 rootstock; L, leaves; B, berries.

