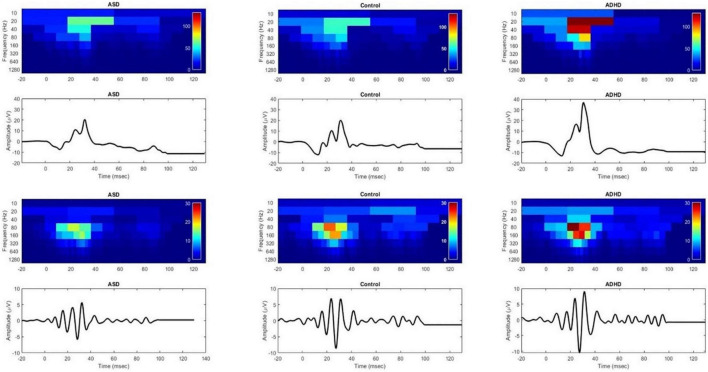
FIGURE 1.
DWT scalograms of the ERG and OPs waveforms for ASD, control and ADHD normalized to the color scale of the ADHD participant using a Flash Strength of log 1.204 photopic cd.s.m–2. Red indicates greater energy levels and blue low energy levels. Upper panel shows the ERG waveforms and lower panels show the corresponding OP waveforms. In the upper panel the b20 and b40 bands of the ASD scalogram are not significantly different from that of the control. In contrast the ADHD participant’s recording shows increased energy within all frequency bands of the scalogram compared to the ASD and control. The lower panels, show a reduced op80 and op160 energy in the ASD participant compared to the control.

