FIGURE 1.

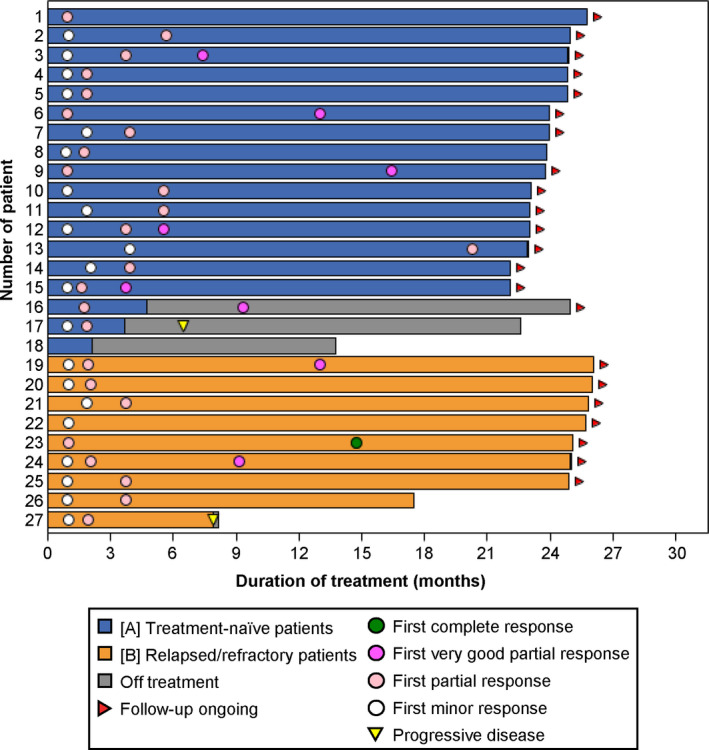
Duration of treatment and responses. A swimmer plot shows the duration of treatment, the first timings of responses, and the timing of progressive disease for each patient

Duration of treatment and responses. A swimmer plot shows the duration of treatment, the first timings of responses, and the timing of progressive disease for each patient