
FIGURE 1.
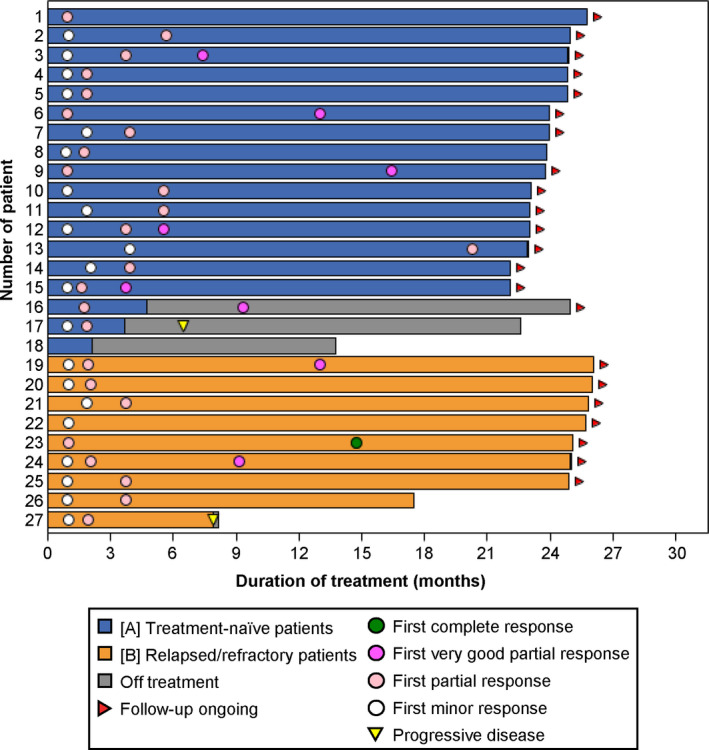
Duration of treatment and responses. A swimmer plot shows the duration of treatment, the first timings of responses, and the timing of progressive disease for each patient
Official websites use .gov
A
.gov website belongs to an official
government organization in the United States.
Secure .gov websites use HTTPS
A lock (
) or https:// means you've safely
connected to the .gov website. Share sensitive
information only on official, secure websites.
Duration of treatment and responses. A swimmer plot shows the duration of treatment, the first timings of responses, and the timing of progressive disease for each patient