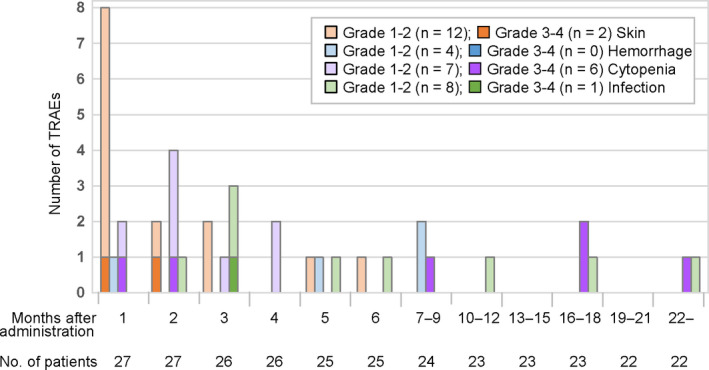
FIGURE 4.

First onset of each category of treatment‐related adverse events (TRAEs). TRAEs in each category are listed in Table S1. The number of patients who continued to be followed at the first day of each month or period is shown. Note: Two patients initially exhibited grade 1–2 cytopenia and later developed grade 3–4 cytopenia
