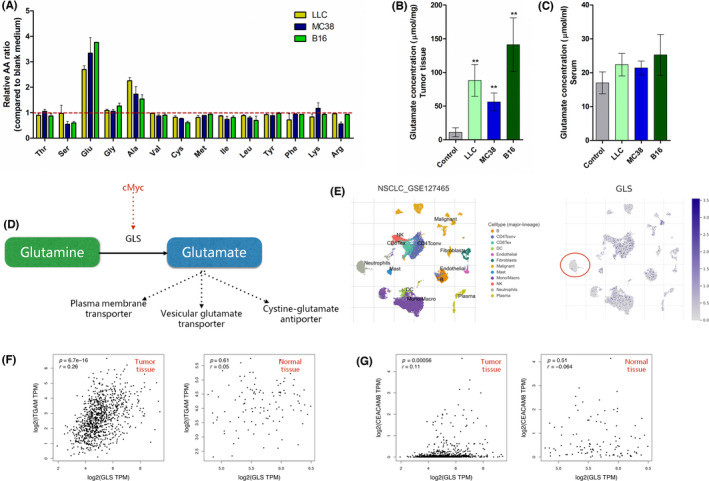
FIGURE 1.

Analysis of glutamate production and glutaminase (GLS) expression in tumor. (A) Fourteen amino acids (AAs) in culture medium from three tumor cell lines (LLC, MC38, and B16). n = 3. (B) Glutamate concentration in tumor tissue was detected when tumor size reached 150 mm3. Control represents paratumor tissues. (C) Glutamate concentration in serum. Control represents tumor‐free mice. n = 5 for B and C. (D) Schematic diagram of glutamate synthesis and release. (E) Tumor Immune Single‐cell Hub database analysis of GLS expression comparison in human tumor tissue. Left panel presents different cell types. Right panel shows the relative GLS expression log2(transcripts per million [TPM]) in different cell types. (F, G) Gene Expression Profiling Interactive Analysis correlation analysis between GLS and ITGAM (CD11b)/CEACAM8 (CD66b) in The Cancer Genome Atlas human non‐small‐cell lung cancer (NSCLC) database (lung adenocarcinoma and lung squamous cell carcinoma, n = 481) and related normal tissues (n = 126). Correlation coefficients (r) were calculated by Pearson analysis with p value included
