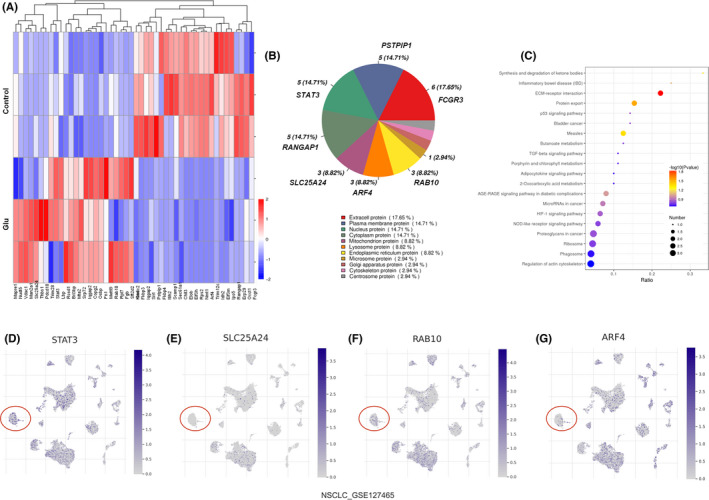
FIGURE 4.

Differential protein expressions on neutrophils after glutamate treatment. (A) Mass spectrometry protein analysis for neutrophils with/without glutamate stimulation (100 μM). Differential proteins were visualized after log2 conversion. Red, upregulation; blue, downregulation. n = 3. (B) Subcellular distributions of differential proteins after glutamate treatment. Proteins are listed in each subcellular compartment. (C) Enrichment of differential protein‐related pathways based on the Kyoto Encyclopedia of Genes and Genomes database. (D–G) Tumor Immune Single‐cell Hub database analysis of STAT3/SLC25A24/RAB10/ARF4 expression comparison in human non‐small‐cell lung carcinoma (NSCLC) tumor tissue. Red circle indicates neutrophil subpopulation (cell population annotation is shown in Figure 1E). Purple bar represents log2(transcripts per million) of intended gene
