
FIGURE 6.
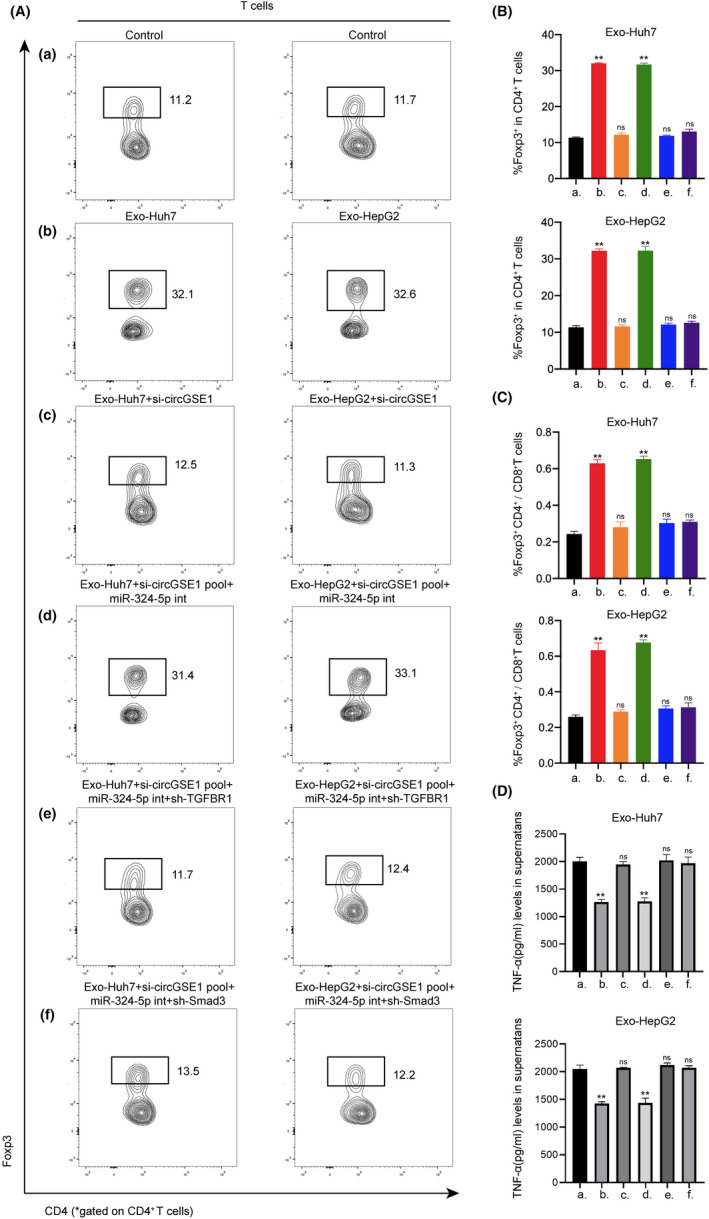
Hepatocellular carcinoma (HCC)‐derived exosomal circGSE1 induces the expansion of Tregs via the miR‐324‐5p/TGFBR1/Smad3 axis. A‐C, Flow cytometry analysis of the ratio of Foxp3+ T cells in CD4+ T cells and the Foxp3+ CD4+/CD8+ T cells ratio after indicated treatment. D, ELISA analysis of the IFN‐γ secretion after indicated treatment. All data are means ± SD; n = 3, *p < 0.05, **p < 0.01, ***p < 0.001