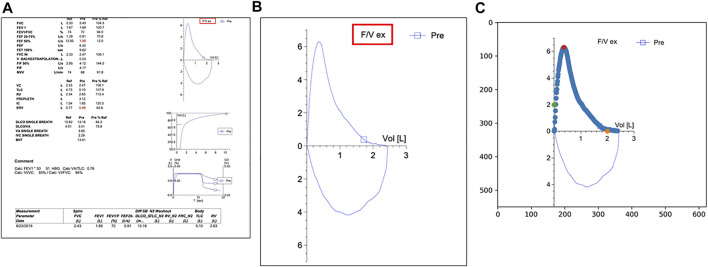
FIGURE 1.
(A) A typical PFT report in the electronic medical record system used by Duke University Medical Center (EPIC). The label highlighted by the red box is used as an identifier to locate the flow volume loop (FVL) on the page. (B) The target FVL extracted by the algorithm; (C) The green dots and the orange dots are used for y-axis and x-axis alignment respectively. The red dot indicates the point of the peak expiratory flow.

