
FIGURE 2.
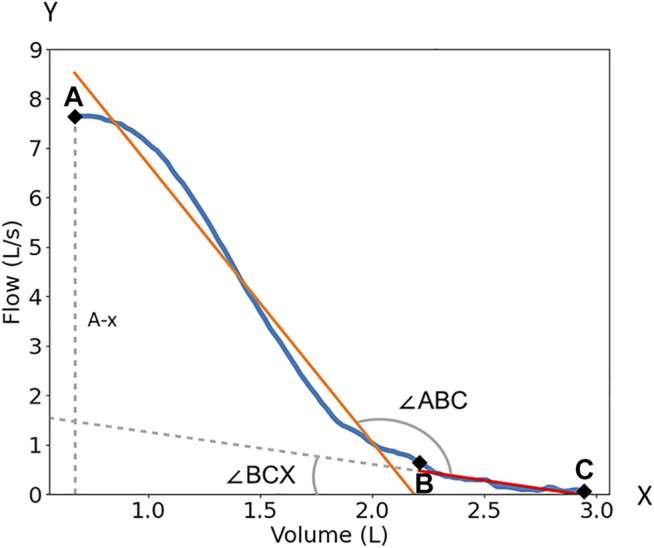
The quantification of the FVL. Point A is the peak expiratory flow of the flow volume loop; Point B is the 75% point of the maximum volume; Point C is the end of the curve. ∠ABC is the angle between the linear fitting of AB and BC. ∠BCX) is the angle between the linear fitting of BC and x-axis. BC/A-x is the ratio of the BC slope over peak flow or the vertical distance (dash line) between A and x-axis (A-x). The orange line is the linear fitting of the AB segment. The redline with dash line extension is the linear fitting of the BC segment.