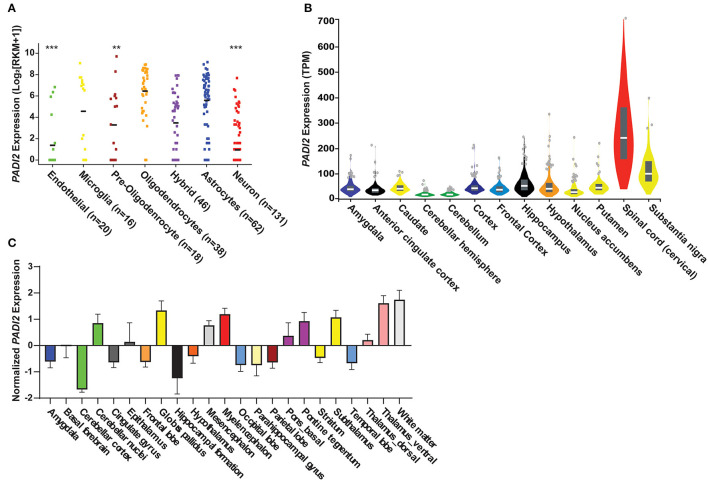
Figure 1.
PAD2 transcripts are detectable in glia in the human central nervous system. (A) in silico analyses of single cell RNA-sequencing data from the GEO human cortex show PADI2 expression in reads per kilobase of transcript per million (RPKM; y-axis) in various cell types (x-axis) of the CNS. The number of cells analyzed in each group is provided after the region in paratheses. The mean RPKM of oligodendrocytes was compared to that to the mean of each other cell type in the dataset by ANOVA with Kruskal–Wallis test to corrected for multiple comparisons. ****p-value < 0.0001; **p-value < 0.01. (B) PADI2 expression from bulk RNA sequencing of different CNS regions was downloaded from the GTEx database and gene expression in transcript per million (TPM) is plotted (y-axis) for different brain regions and the spinal cord (x-axis). Image is modified from (https://gtexportal.org/home/gene/PADI2). (C) Transcript expression of PADI2 in different regions of the brain measured by microarray was downloaded from The Allen Institute. Normalized PADI2 gene expression (y-axis) is shown for multiple brain regions (x-axis).

