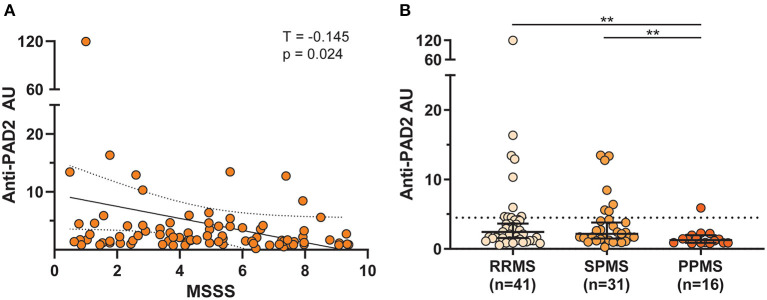
Figure 3.
Anti-PAD2 antibody levels by MS subtype and disease severity. (A) Scatterplot showing the multiple sclerosis severity score (MSSS) plotted against anti-PAD2 arbitrary units (AU) of all comers with MS with available clinical data (n = 88). A univariate analysis was performed between MSSS and anti-PAD2 AU and the Kendall's Tau correlation coefficient (T), p-value, trendline (solid black line), and 95% confidence intervals (dotted black lines) are shown. (B) Anti-PAD2 Arbitrary Units (AU) in people with RRMS (n = 41), SPMS (n = 31), and PPMS (n = 16) were plotted and compared using a Kruskal–Wallis test adjusted for multiple comparisons. The median and 95% confidence interval are shown. **p < 0.01.

