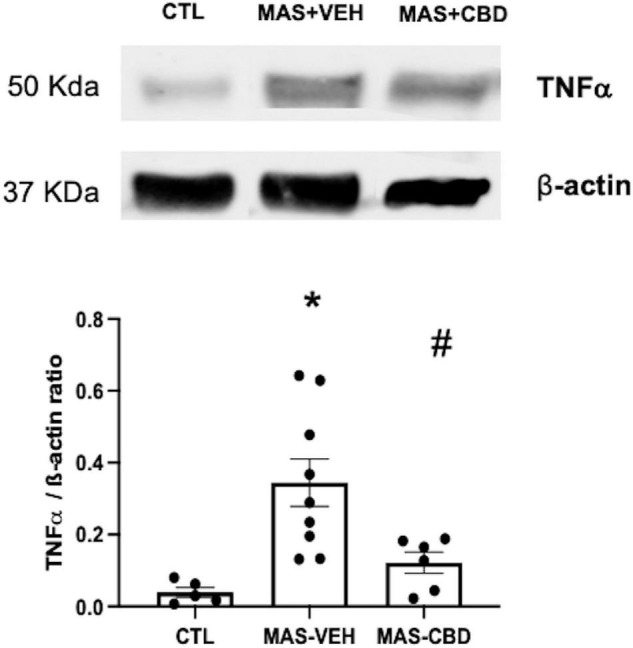
FIGURE 4.

Concentration of TNFα as measured by western blot in lung tissue from ventilated control (CTL, n = 6) animals and piglets submitted to meconium aspiration (MAS) and then treated with i.v. vehicle (VEH, n = 10) or CBD (n = 6). Bars represent the mean (SEM) of 6–10 animals. Protein levels were normalised to β-actin loading and expressed as TNF-α/β-actin ratio. (*) p < 0.05 vs. CTL, (#) p < 0.05 vs. MAS + VEH by one-way ANOVA with Holm-Šidák’s post-hoc test for multiple comparisons.
