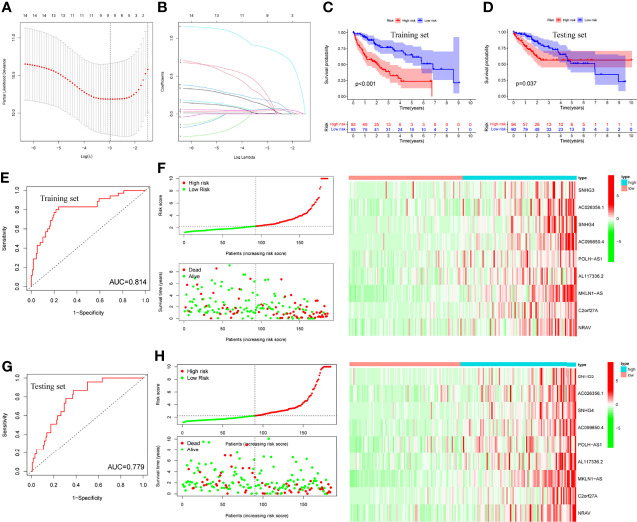
Figure 5.
LASSO regression, survival plots and risk score models. (A, B) LASSO regression plots, (C, D) Survival analysis of training and testing sets by risk groups, respectively, (E, F) Risk score model, ROC curve and heatmap of training set, (G, H) Risk score model, ROC curve and heatmap of testing set.

