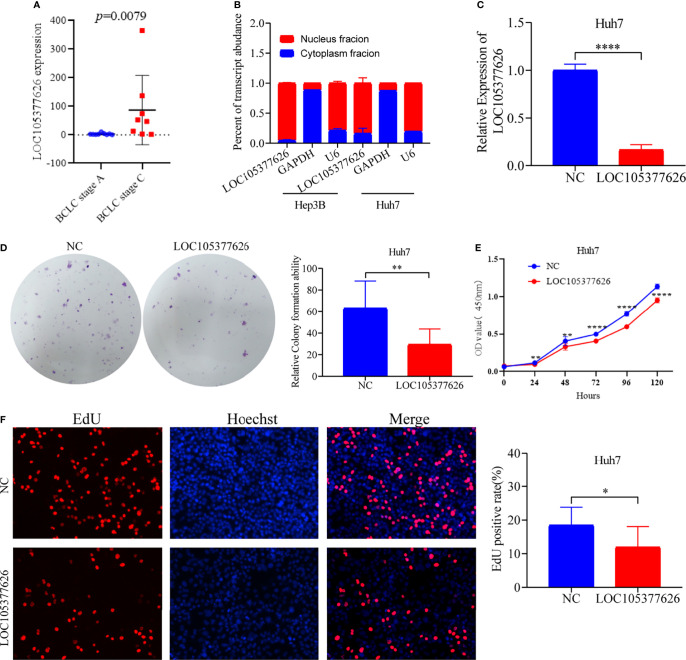
Figure 9.
Differential expression, cellular location, and in vitro experiments of LOC105377626. (A) Differential expression of LOC105377626 between TNM stage A and stage C, (B) Cellular location results of LOC105377626 in Hep3B and Huh7 cell lines, (C) Relative expression of LOC105377626 in control and knockdown groups, (D–F) Results of colony formation, CCK-8 and EdU assays between LOC105377626 control and knockdown groups. * means P<0.05. ** means P<0.01.**** means P<0.0001.

