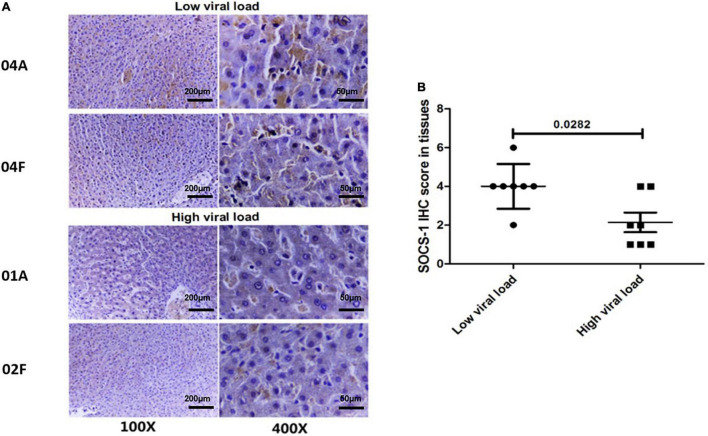
FIGURE 3.
Tissues with a high viral load exhibit a lower level of SOCS-1 expression when they have similar histological inflammation. (A) Representative images of SOCS-1 expression in adjacent and distal tissues with different viral loads. “04, 01, and 02” represent patients’ numbers. “A” represents adjacent tissues. “F” represents distal tissues (scale bar = 50 μm in 400× images, 200 μm in 100× images). (B) Axiotis score of SOCS-1 expression in adjacent and distal tissues with different viral loads (Wilcoxon paired test).

