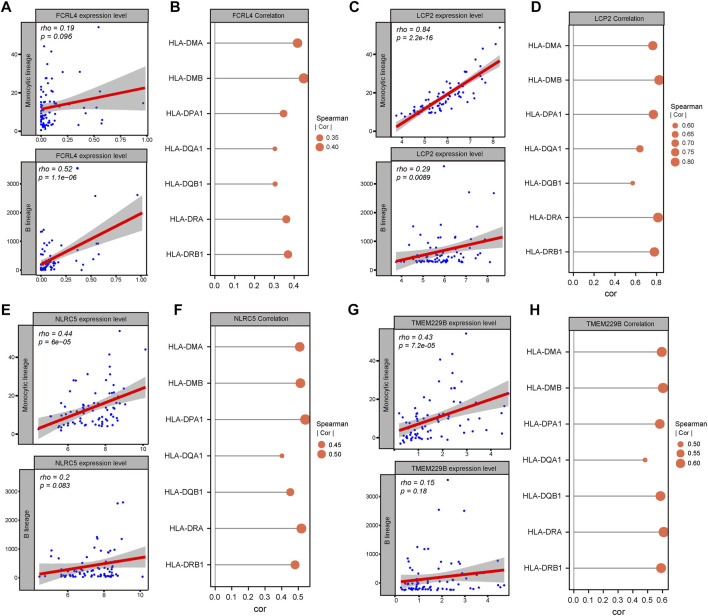
FIGURE 4.
Identification of candidate tumor antigens associated with APCs and MHC class II. (A) Correlation between FCRL4 expression and estimated macrophage and B cell scores. (B) Correlation between FCRL4 expression and MHC II expression. (C) Correlation between LCP2 expression and estimated macrophages and B cells scores. (D) Correlation between LCP2 expression and MHC II expression. (E) Correlation between NLRC5 expression and estimated macrophages and B cells scores. (F) Correlation between NLRC5 expression and MHC II expression. (G) Correlation between TMEM229B expression and estimated macrophage and B cell scores. (H) Correlation between TMEM229B expression and MHC II expression.

