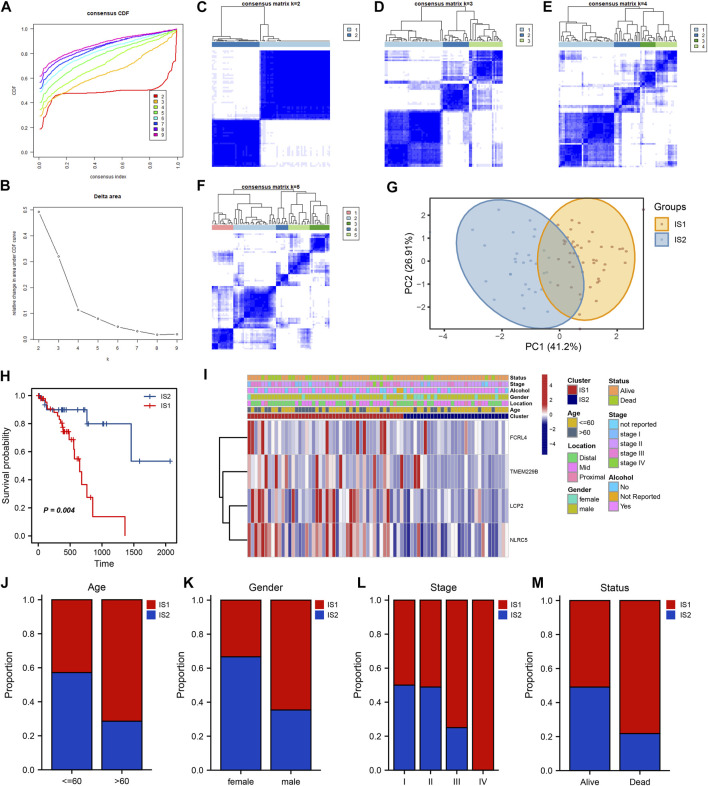
FIGURE 5.
Identification of potential ESCC immune subtypes. (A) Consensus clustering the cumulative distribution function curve for k = 2 to k = 9. (B) Relative change in area under the cumulative distribution function curve. (C–F) Clustering heatmap for k = 2 to k = 5. (G) PCA plot showing the distribution of IS1 and IS2. (H) Kaplan–Meier curve showing the OS of IS1 and IS2 in the TCGA cohort. (I) Heatmaps showing the relationship between potential ESCC antigens and clinical characteristics in different immune subtypes. (J–M) Distribution ratio of IS1 and IS2 across age, gender, stage and survival status in ESCC patients.

