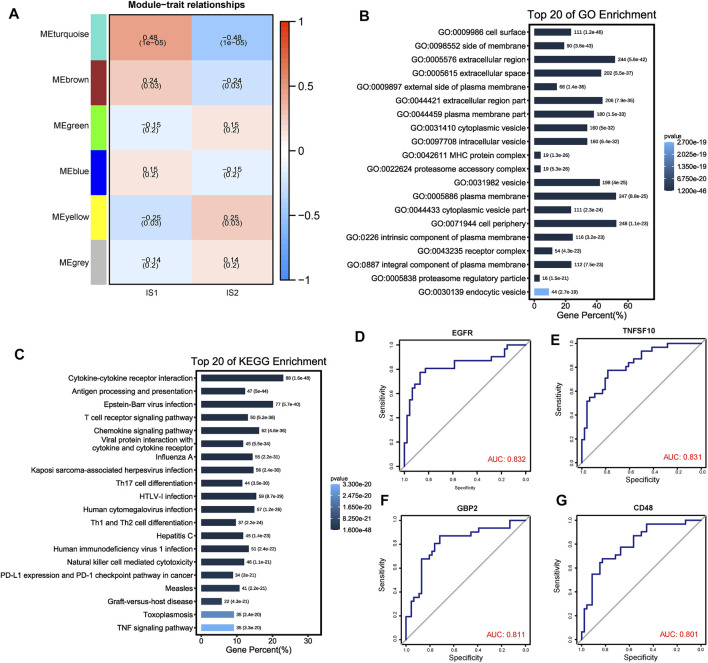
FIGURE 8.
Identification of immune gene co-expression modules of ESCC. (A) Heatmap showing the relationship between the gene module eigenvalues and different immune subtypes. The number above each model represent correlations, numbers below represent p value. (B, C) Top 20 GO and KEGG enriched functions and pathways of “MEturquoise” module genes. (D–G) ROC plots showed the four genes with a suitable predictive ability for the prognosis with AUC >0.8.

