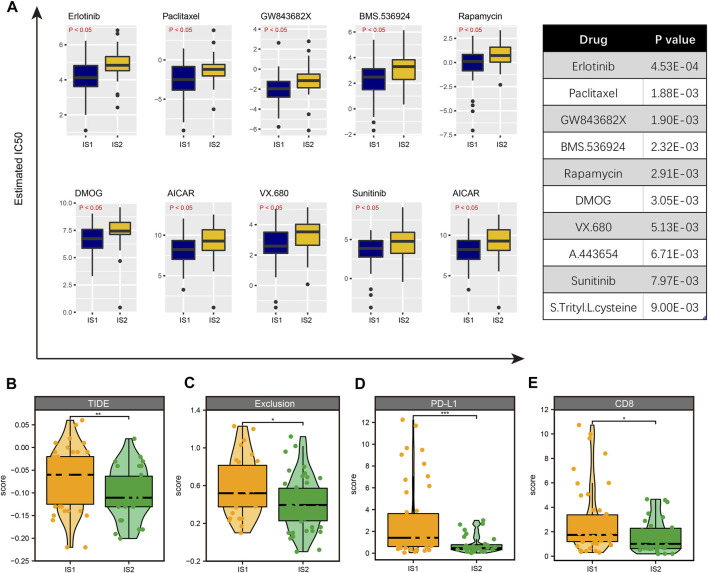
FIGURE 9.
Identification of drug sensitivity in IS1 and IS2 subtypes. (A) The 10 drugs with the most significant differences ranked by p-value. (B) The TIDE score is higher in IS1 than in IS2. (C) The exclusive score is higher in IS1 than in IS2. (D) The PD-L1 score is higher in IS1 than in IS2. (E) The CD8 score is higher in IS1 than in IS2.

