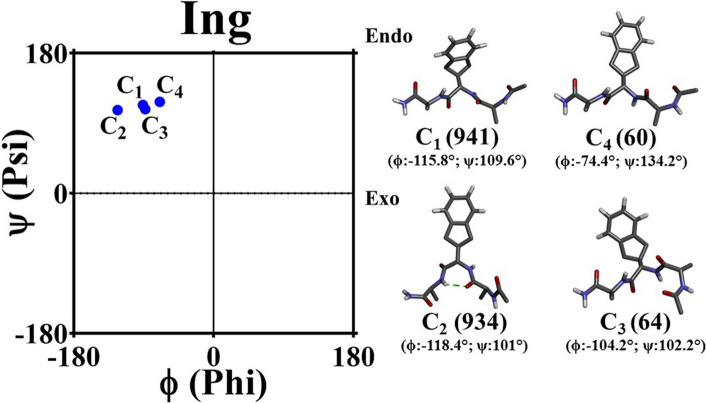
Fig. 4.
Schematic illustration of the central conformers of the most populated clusters evolved for the Ac-Ala-Ing-Ala-NH2 tripeptide over the duration of MD. The data are representative of both the “endo” and “exo” trajectory. The number within the parenthesis indicates the total number of conformers for the given major cluster. The dotted green lines highlight the backbone hydrogen bonds

