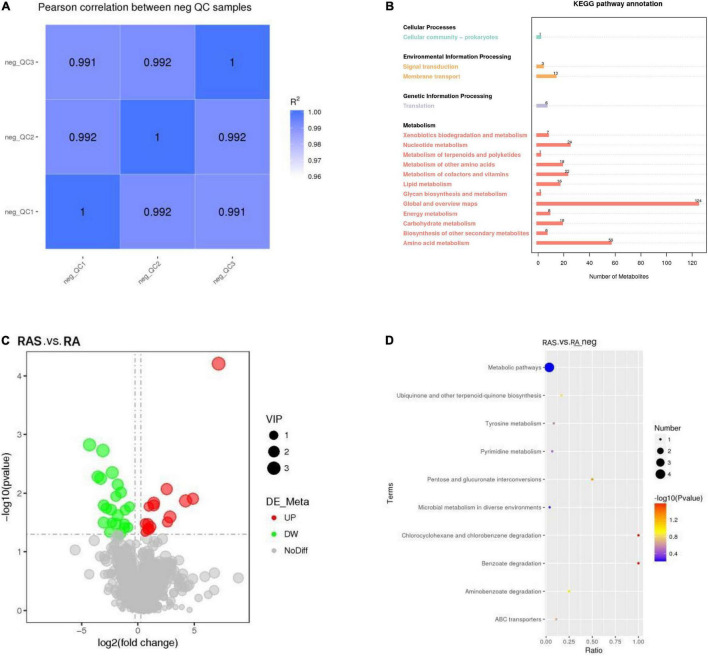
FIGURE 2.
(A) QC samples correlation analysis; (B) The Kyoto Encyclopedia of Genes and Genomes (KEGG) pathway annotation; (C) The volcano plot of difference metabolites; (D) enrichment of differential metabolites in KEGG pathways. Rich factor, ratio of the proportion of differential metabolites to the proportion of all metabolites in the pathway; the size of the dots in the graph represents the number of distinct metabolites enriched in the corresponding pathways.

