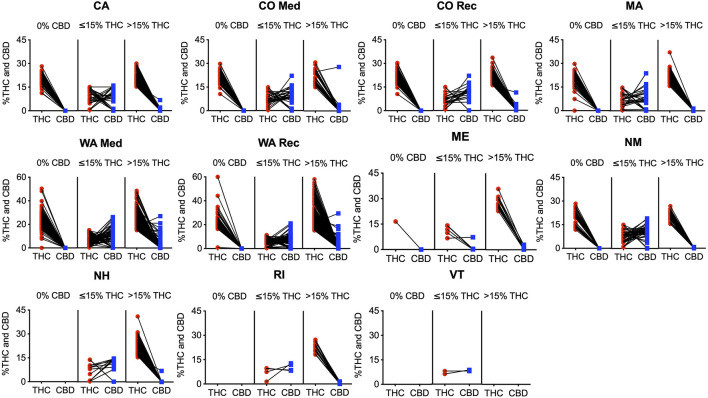
FIGURE 4.
All individual products with CBD content information with corresponding THC and CBD percentage in each state. The first column for each graph contains all products with 0% CBD and their corresponding THC content; the second and third columns contain products with >0% CBD, with the second column containing products with ≤15% THC, and the third column containing products with >15% THC.

