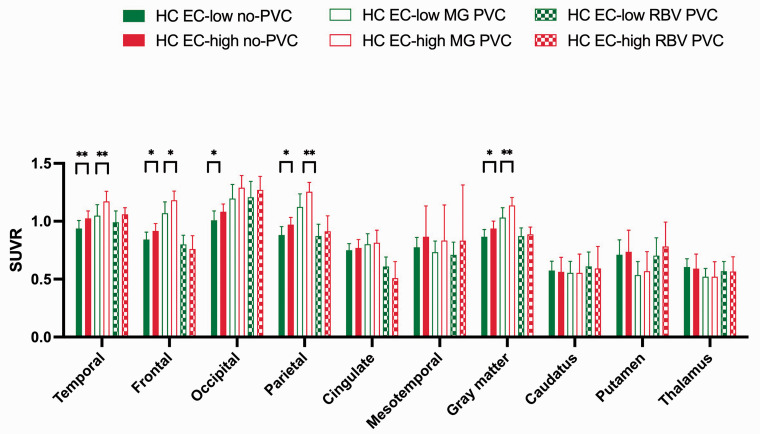
Figure 2.
Mean regional [18F]MK-6240 SUVR values of 10 HC with low (green) and high (red) extracerebral tracer uptake respectively. Filled bars indicate SUVR values without PVC; empty bars indicate SUVR values with MG PVC; pattern bars indicate SUVR values with RBV PVC taking into account extracerebral tracer uptake. Significant differences are presented by *(p < 0.05); **(p < 0.01). SUVR: standardized uptake value ratio; HC: healthy controls; EC: extracerebral; MG: Müller-Gartner; PVC: partial volume correction; RBV: region-based voxelwise.

