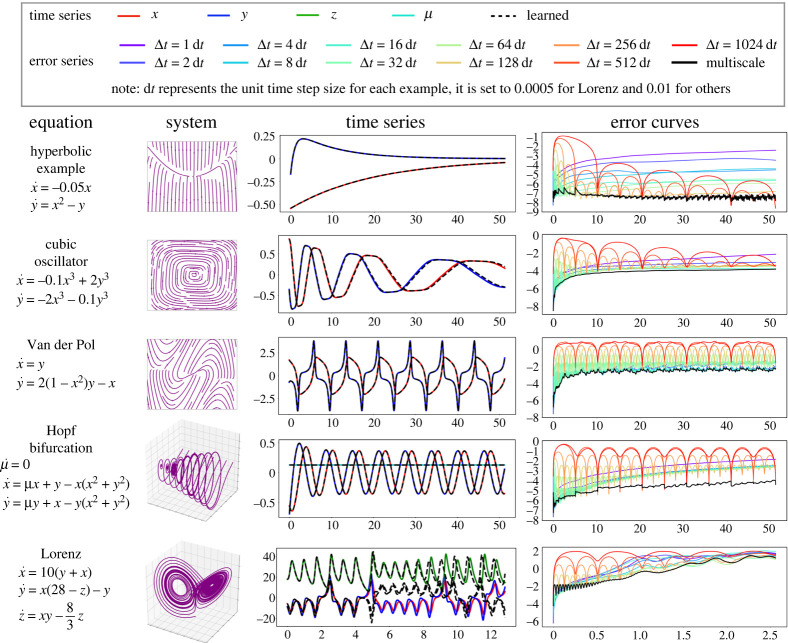
Figure 5.
Performance of multiscale HiTSs on nonlinear systems. In the first two columns, systems of equations and phase portraits are visualized. In the third column, we visualize the predictions of multiscale time-steppers on a testing trajectory. In the last column, mean squared errors at each step are visualized in the base-10 logarithmic scale for different time-steppers. (Online version in colour.)

