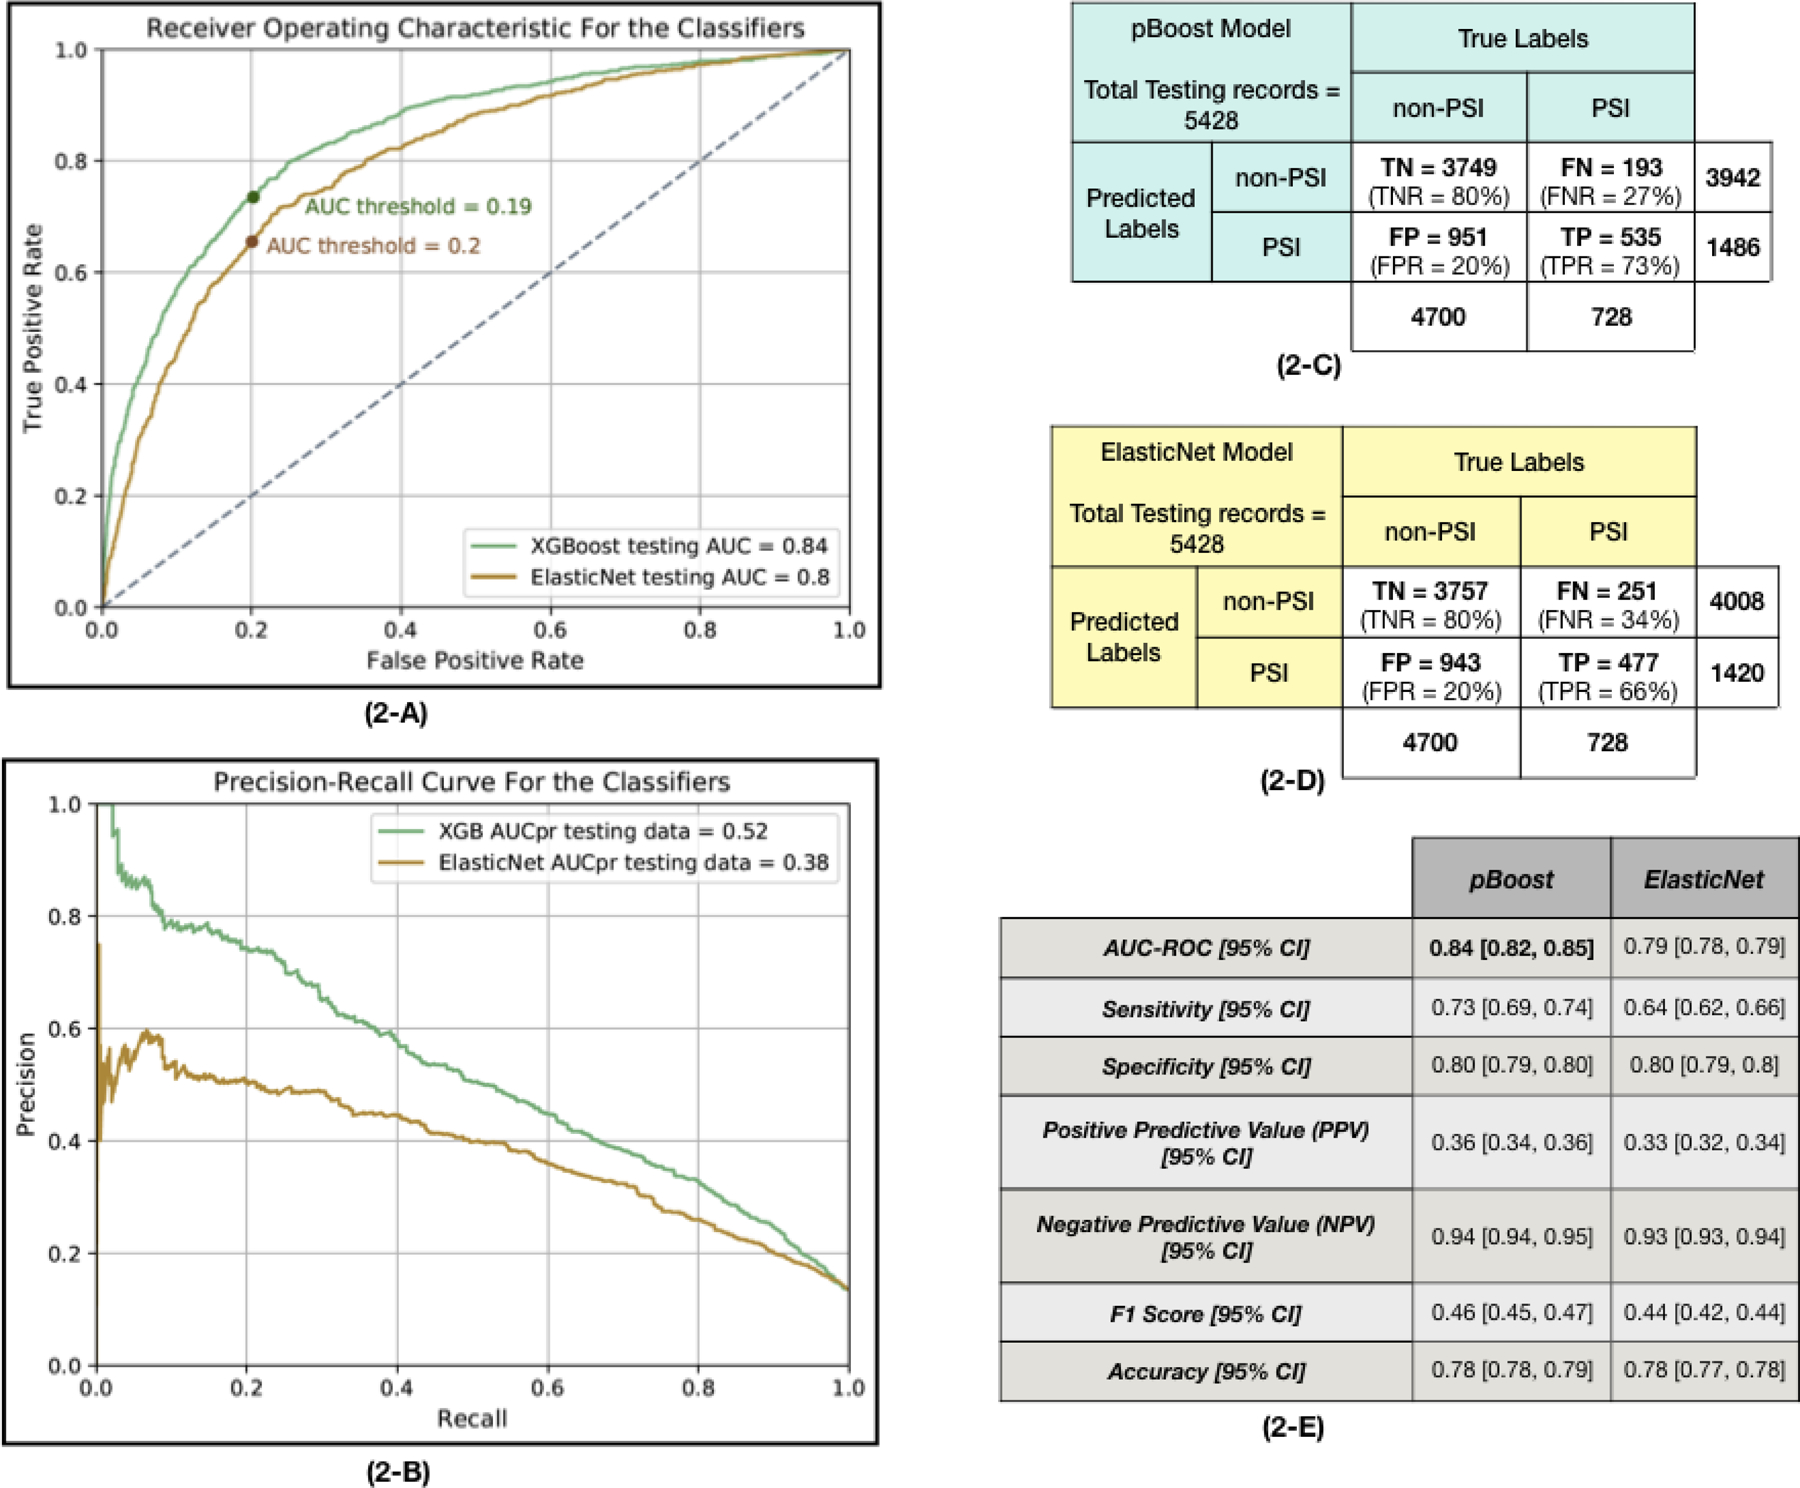
Figure 2. The predictive models’ performance.

(2-A) The Receiver Operating Characteristic (ROC) plot for pBoost and ElasticNet models applied to the testing dataset. This plot demonstrates the trade-off between the sensitivity and specificity of the classifiers. To find the optimum AUC threshold, the specificity is fixed at 0.80 and the rest of the metrics are calculated. The selected AUC threshold is marked on each curve. (2-B) Precision-Recall curve (PRC) for pBoost and ElasticNet models applied to the testing dataset. A PRC plots the positive predictive value (precision or PPV in the y-axis) against the true positive rate (recall or sensitivity in the x-axis). In class-imbalanced data classification, it is more informative to look at both ROC and PRC to consider the trade-off between PPV and sensitivity. (2-C) The confusion matrix of applying the pBoost model on the testing dataset. This table presents the True Positive (TP), True Negative (TN), False Positive (FP) and False Negative (FN) values that are calculated based on the optimal AUC threshold marked on the ROC plots in part 2-A of this figure. The total number of PSI and non-PSI records and the total number of predicted labels of each class are mentioned in the confusion matrix. (2-D) The confusion matrix associated with the ElasticNet classifier. (2-E) Two predictive models, ElasticNet and pBoost, are employed to predict if a given patient encounter will develop PSI during the next 8 hours of hospital stay. The AUC values are reported for testing subsets of the data. To make a better comparison among the results, the specificity level is fixed at 0.80 and the rest of the performance measurements are calculated subsequently. The mean and 95% confidence interval of each metric are reported.
