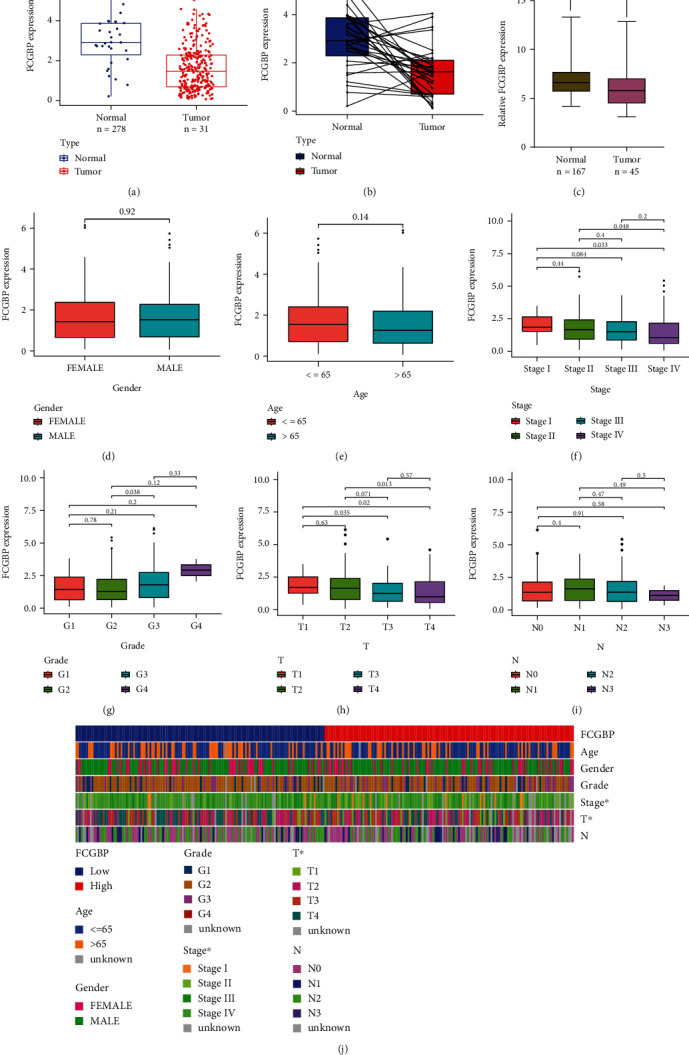
Figure 1.

The expressing pattern of FCGBP in OSCC patients. (a, b) The expression of FCGBP was distinctly decreased in OSCC samples compared with nontumor samples from TCGA datasets. (c) Lower levels of FCGBP were observed in OSCC in OSCC samples than nontumor samples from GSE30784 datasets. (d–i) The association between FCGBP expression and gender, age, stage, grade, T stage, and N stages. (j) Heat map showed the associations between FCGBP expressions and clinical factors. ∗p < 0.05, ∗∗∗p < 0.001.
