
Figure 4.
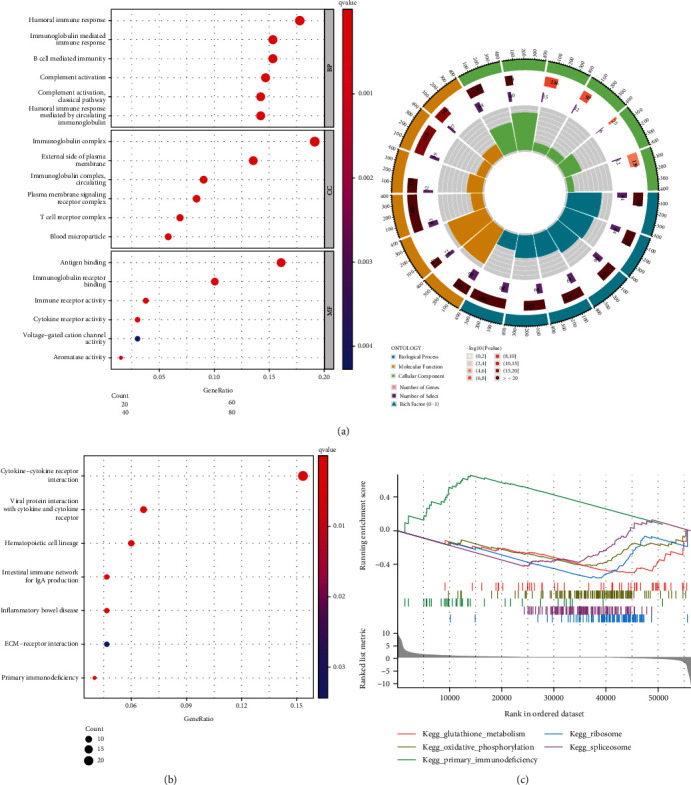
Functional analysis based on the DEGs between the two groups in the TCGA cohort. (a) Bubble graph for GO enrichment. (b) Bar plot graph for KEGG pathways. (c) Enrichment plots from GSEA.
Official websites use .gov
A
.gov website belongs to an official
government organization in the United States.
Secure .gov websites use HTTPS
A lock (
) or https:// means you've safely
connected to the .gov website. Share sensitive
information only on official, secure websites.
Functional analysis based on the DEGs between the two groups in the TCGA cohort. (a) Bubble graph for GO enrichment. (b) Bar plot graph for KEGG pathways. (c) Enrichment plots from GSEA.